

Abstract
OBJECTIVE We aimed identification of cell surface molecules, which might serve as diagnostic biomarkers or useful targets for therapies, in breast cancer.
METHODS We developed unique DNA microarray coupled with spherical self-organizing map (sSOM) analysis to characterize cells and tissues by the cell surface markers. In the microarray 1,797 probes for human genes coding membrane bound proteins were spotted. With this microarray the gene expression profiles of eight breast carcinoma cell lines were compared to identify the genes that were commonly expressed in breast carcinomas but not in normal cells.
RESULTS The gene expression profiles of sSOM from the eight breast carcinoma cell lines were successfully distinguished from that of normal breast tissue derived cells suggesting the presence of genes of interest. sSOM on the data extensively filtered revealed several candidate genes, of which expression was significant in carcinoma cells but low in normal cells. Finally, TM9SF2 was nominated through validations of PCR procedures together with CD24 and ErbB3, which are known breast carcinoma markers. TM9SF2 expression was further confirmed by immunological staining. Interestingly, TM9SF2 was found to be expressed in all the cell lines evaluated while CD24 and ErbB3 were not in all of the carcinoma cells, supporting their relationship in sSOM. Although physiological significance of TM9SF2 is unknown yet, siRNA treatment significantly inhibited the growth of MDA-MB-231 cells.
CONCLUSION We propose TM9SF2 as a novel and useful diagnostic marker as well as a potential molecular target specific to breast carcinoma cells covering wide range of breast cancer.
keywords
Introduction
Membrane bound proteins are critical for cellular differentiation and function, and alterations in these proteins often leads to cell dysfunction and disease[1]. Therefore they could be sometimes good candidate markers on the cell surface to identify or distinguish abnormal cells. Many biomarkers of diseases are known but most of them are soluble proteins, which could be detected easily in body fluids such as blood or urine. We can find some disorders from the altered level of those biomarkers. However, they are telling only the presence of disorder but not the precise location of the disease in the body. Efforts to identify membrane bound proteins and elucidate their dynamics have been plagued by the challenges presented by studying water insoluble proteins that are distributed among a range of membranes in a cell and often occur at a relatively low abundance. This might be one of the major reasons why the cell surface markers of diseases have not been so much identified up to date.
In investigation of the expression patterns of thousands of genes, DNA microarrays provided prognostic and predictive markers[2] and candidate genes[3] in breast cancer. However, no such a study has been done to scan cancer probes in respect to the expression patterns of cell surface proteins, which can be cell surface receptors, growth factor receptors or cell adhesion molecules. Particularly it is important to identify a difference of gene expression between tumor and corresponding adjacent normal tissues[4]. This heterogeneity of cell surface protein expression makes these molecules useful markers for tumor specific targeting[5-7] since cell-surface proteins are considered to be more accessible to immune mechanisms and drug delivery systems[8]. Recently we have developed DNA microarrays carrying the probes for the genes coding cell surface proteins[8-10]. We consider this design is highly efficient for downstream procedure of screening for cell surface markers.
Hierarchical clustering and self-organizing map (SOM) clustering have widely been used to extract useful information from gene expression profiles. When compared to hierarchical clustering, SOM has a number of features well suited to cluster genes[11]. Spherical SOM (sSOM) has been demonstrated to be effective to remove boundary effect conveying the information of distance and direction[12].
In this paper, we describe the identification of cell surface proteins, which should be available as the marker of breast carcinoma cells employing our original DNA microarrays coupled with sSOM analysis.
Materials and Methods
Cell lines and cell culture
Human breast cancer derived cell lines together with normal cell line used in this study are summarized in Table 1. These cell lines were derived from breast tissues of breast cancer patients at various ages of Caucasian females. All cells were maintained at 37°C in a humidified 5% CO2 atmosphere except MDA-MB-134 cells, which were maintained in 100% air.
List of cell lines used in this study.
Preparation of total RNA
Total RNA was extracted from the cell lines used in this study. Cells were harvested at a confluence of 80% for preparation using RNeasy Mini kits (Qiagen), following the manufacturer’s instructions. RNA integrity and purity was assessed by OD260/280 measurements and by the ratio of 28S and 18S rRNA with Experion system (BioRad Labs). The total RNA was further treated with DNase and purified. The integrity of template RNA was assessed by OD260/280 measurements.
Preparation of control RNAs
Control RNAs were designed in our microarray analysis procedure so that we might monitor the cDNA synthesis and hybridization. Five sequences of control RNA were selected based on the fact they have no homology to any described human, mouse or rat genes. They were jellyfish Aequorea victoria gene coding green fluorescent protein (GFP) (GeneBank accession No. U76561), bacterial genes coding chloramphenicol acetyltransferase (Genebank accession No. U57026), β-lactamase (GeneBank accession No. X65335), β-galactosidase (GeneBank accession No. X65335) and neomycin phosphotransferase (GeneBank accession No. U55762). For in vitro synthesis of the control RNAs, we inserted a 756-bp fragment derived from the GFP cDNA sequence together with an extension of poly (A)24 downstream of the T7 promoter to construct a plasmid pBO795. In the same way, a 781 bp, 770 bp, 781 bp and a 699 bp fragments derived from chloramphenicol acetyltransferase (CAM), β-lactamase (β-lac), β-galactosidase (β-gal) and neomycin phosphotransferase (Neo) coding sequences were inserted to construct plasmids pBO902, pBO903, pBO904 and pBO905, respectively. The DNA fragments containing T7 promoter sequence were amplified from the plasmids by PCR as linear templates for in vitro transcription. The transcription reaction with T7 RNA polymerase was carried out at 37°C for 4 h. The resultant RNAs were treated with DNase and purified. Finally, the integrity of control RNAs was assessed by OD260/280 measurements followed by agarose gel electrophoresis.
Preparation of DNA microarray
DNA microarray carrying 1,797 oligonucleotide probes for human cell surface proteins were designed. The probes were designed to include the DNA sequence coding the transmembrane region or the GPI-anchor attachment site, which were essential for proteins to be integrated into the membrane. Simultaneously, the probes complementary to the control RNAs described above were designed. Each probe was synthesized as 60-mer oligonucleotide with NH2 group at the 5’ end and spotted in duplicate onto DLC-coated glass slides with DNA spotting tool, SPBI0TM (Hitachi software engineering, Japan) as previously described by Tuoya et al.[9,10]
Microarray analysis
Prior to cDNA synthesis against the total RNA from each cell line, each control RNA (0.25 ng for β-gal, 0.5 ng for Neo, 1 ng for CAT, 2 ng for GFP and 4 ng for β-lac) was supplemented to 20 μg of each total RNA. Fluorescent-labeled cDNAs were prepared by Superscript II reverse transcriptase (Invitrogen) with oligo-dT primer from the RNA mixtures in the presence of amino-allyl-dUTP followed by the coupling of Cy3 dye (Ambion, TX). The labeled cDNA was purified with QIAquick PCR Purification Kit (Qiagen) and then used for hybridization to the DNA microarray prepared at above 55°C for 15 h. Fluorescent images of hybridized microarrays were captured using the FLA8000 scanner (Fuji Film, Japan) and analyzed using GenePix Pro 5.1 software (Axon Instruments, CA). Each result of hybridization was qualified by the intensity of the spots from the control RNAs. When the intensity of these spots was obtained as the gradient correlating with each amount of control RNAs supplemented before cDNA synthesis, the signals were analyzed for further steps.
Data filtering and sSOM analysis
As described previously[9,10], the intensity of each signal of gene expression levels was calculated as relative fluorescent intensity (RFI), which is the percentage of the fluorescent intensity of each gene when the signal of the control RNA of GFP is considered to be 100%. In order to eliminate genes, of which expression did not change significantly between carcinoma derived cell lines and normal cell line, we evaluated the scores for each gene by a filtering formula |A−G| − V, where “A”, “G”, and “V” denote the expression level of a gene in normal cell line Hs 578Bst, the average expression level of the gene in the eight breast carcinoma cell lines, and the standard deviation of the gene expression level among the eight breast carcinoma cell lines, respectively. Genes were eliminated from further process if the score did not show |A−G| − V > 0, since only the genes with a score greater than the threshold (i.e., zero) are deemed potentially significant. Then the RFIs for each gene were normalized for all individual microarrays to fall within two absolute values 0 and 1, where 1 represented the highest RFI value. The normalized data set was used for clustering genes by the sSOM software Blossom (SOM Japan, Co. Ltd., Japan). The gene expression profiles of each cell line were obtained as the result. Next, we further filtered the number of genes to identify the genes, which were commonly expressed in carcinoma cells but not in normal cells applying a more stringent filtering formula (Cn−A)average − (Cn−A)standard deviation > 0, where Cn was the expression level of a gene in any of the eight cancer cells and A was the counterpart gene expression level in the normal cells. The differences of RFI values (Cn −A) between each carcinoma cell line (Cn) and normal cell line (A) for each gene were first calculated and normalized to fall within 0 and 1 as described above. The normalized data set was analyzed by Blossom again.
Reverse transcription PCR
First of all, cDNA was synthesized with reverse transcriptase Superscript II from 5 μg of total RNA with an oligo-dT primer under conventional conditions. The reaction mixture was then diluted 5-fold in water and 2 μl was used as a template for reverse transcription PCR (RT-PCR) amplification. PCR was performed in 20 μl buffer consisting of 1 × ThermoPol Reaction Buffer (New England Biolabs), 200 μM dNTPs, 0.2 μM each primer of sense and antisense and 0.003 U/μl Taq DNA Polymerase (Gibco BRL). The DNA was denatured at 94°C for 5 min followed by 25 PCR cycles of 94°C for 30 s, 55°C for 30 s and 72°C for 30 s with an extension condition of 72°C for 7 min. Products were resolved by standard agarose gel electrophoresis and visualized by ethidium bromide staining under UV light. Primers were designed on the basis of the complete cDNA sequences in the database with Genetyx software (Genetyx, Japan). The primers for TM9SF2 (GenBank accession No. NM_004800) were 5’-TCC ACG TCA GAT TCC TGA AC-3’ (forward) and 5’-CAG TCA ACC TTC ACC ACA CT-3’ (reverse), for CD24 (GenBank accession No. NM_013230) were 5’-CCC CAA ATC CAA CTA ATG CC-3’ (forward), and 5’-CAC CTG GAA GTT CCT TCT CA-3’ (reverse), and for ErbB3 (GenBank accession no. M29366) were 5’-CAT GAG GCCGAA TGC TTC GT-3’ (forward) and 5’-CTC AGG GAT CCA CAC TCC TT-3’ (reverse). The housekeeping gene glyceraldehyde-3-phosphate dehydrogenase (GAPDH) served as an internal standard. The primers of GAPDH was 5’-CCC TTC ATT GAC CTC AAC TAC-3’ (forward) and 5’-CCA CCT TCT TGA TGT CAT CAT-3’ (reverse).
Real-time quantitative PCR
cDNA was synthesized as described above. Then real-time quantitative PCR (RT-qPCR) reactions were carried out in triplicates in a total volume of 20 μl of real-time PCR master mix (Toyobo CO. LTD.) containing 5 ng of template cDNA, 400 nM primers and fluorescent dye SYBR Green, which specifically binds to double-stranded DNA. The primers were the same as used in RT-PCR. Expression level of gene was quantified by LightCyclerR thermal Cycler instrument (Roche). The thermal cycling condition was 50°C for 2 min and 95°C for 10 min followed by 40 cycles of 95°C for 15 s and 60°C for 1 min.
Immunocytochemistry
Prior to immunostaining, cells were seeded onto glass coverslips and cultured for 48 h in 12-well plates. The cells on the coverslips were fixed with 4% paraformaldehyde for 15 min and blocked with 10% FBS for 2 h. Cells were then incubated for 1 h with anti-TM9SF2 rabbit IgG (Atlas antibodies, Sweden) diluted in 30 fold. After rinsing in phosphate buffered saline (PBS), cells were incubated for 30 min with Alexa fluor-488 labeled donkey IgG against rabbit IgG (Invitrogen, CA). The stained cells were observed under a confocal microscope LSM510 PASCAL (Carl Zeiss) with × 63 oil objective lens. Representative photographs from cells were obtained with the same exposure setting for all cells. Identical gain, offset, pinhole and laser settings were used for each sample. All the staining for negative controls was carried out by omitting primary antibodies. Fluorescence area was calculated as percentage of total areas with NIH Image (http://rsbweb.nih.gov/nih-image/) wherever it was necessary.
RNA interference assay
Twenty-four hours before transfection, MDA-MB-231 cells were seeded at 5 × 10⁴ cells/well into a 96-well plate and cultured in fresh media. On the day of transfection, cells in 30%~60% confluent were washed with PBS and the media was replaced with Opti-MEM I reduced-serum medium (Invitrogen, CA). Transfections of siRNA were carried out using lipofectamineTM 2000 (Invitrogen, CA) according to the manufacturer’s instructions. Two short interfering RNAs, siRNA1 and siRNA2 (Qiagen) targeting the coding regions of TM9SF2 from 968~988 and from 818~839, respectively, were added at 50 pmol/well. AllStars negative control siRNA (Qiagen) was used to determine unspecific effect of siRNA transfection. Twenty four hours after the siRNA transfection, 20 μl of 5 mg/mL of 3-(4,5-dimethylthiazol-2-yl)-2,5-diphenyltetrazolium bromide (MTT) (Sigma-Aldrich) was added to each well. Then the plates were incubated in a humidified atmosphere of 5% CO2 at 37°C for 4 h. Solubilization of formazan was performed by adding 100 μl of dimethyl sulfoxide. The absorbance of each well was measured at 570 nm in a microplate reader MTP-120 (Corona electric, Japan). All treatments were carried out in 7 replicates and standard deviation was calculated for each result. To evaluate the significance between the data P values were calculated through Student’s t test.
Results
Gene expression profiling of breast cancer cell lines
We performed DNA microarray gene expression analysis in order to screen genes commonly and specifically expressed in the eight cell lines derived from breast cancer when compared to normal breast cell line Hs 578Bst. As the result of data filtering, 1,022 genes were extracted with each potentially significant difference. The expression levels of these genes were then normalized and subjected to sSOM analysis. The gene expression patterns were visualized on the sphere surfaces (Fig. 1A). In this analysis, ideal point (IP1×8,0), a virtual gene that is expressed in the highest level (i.e. one) in all carcinoma cells but not in normal (i.e. zero), was added to the data set in advance. IP1×8,0 was shown in the center of each profile. The points for each gene were oriented in the same position on each sphere surface. Although the gene expression profiles of eight breast carcinoma cells showed various patterns, every profile showed somewhat high expression of genes around IP1×8,0 while the profile of normal breast cells did show the lowest expression. This implied that there were some candidate genes as the marker specific to breast carcinoma cells.
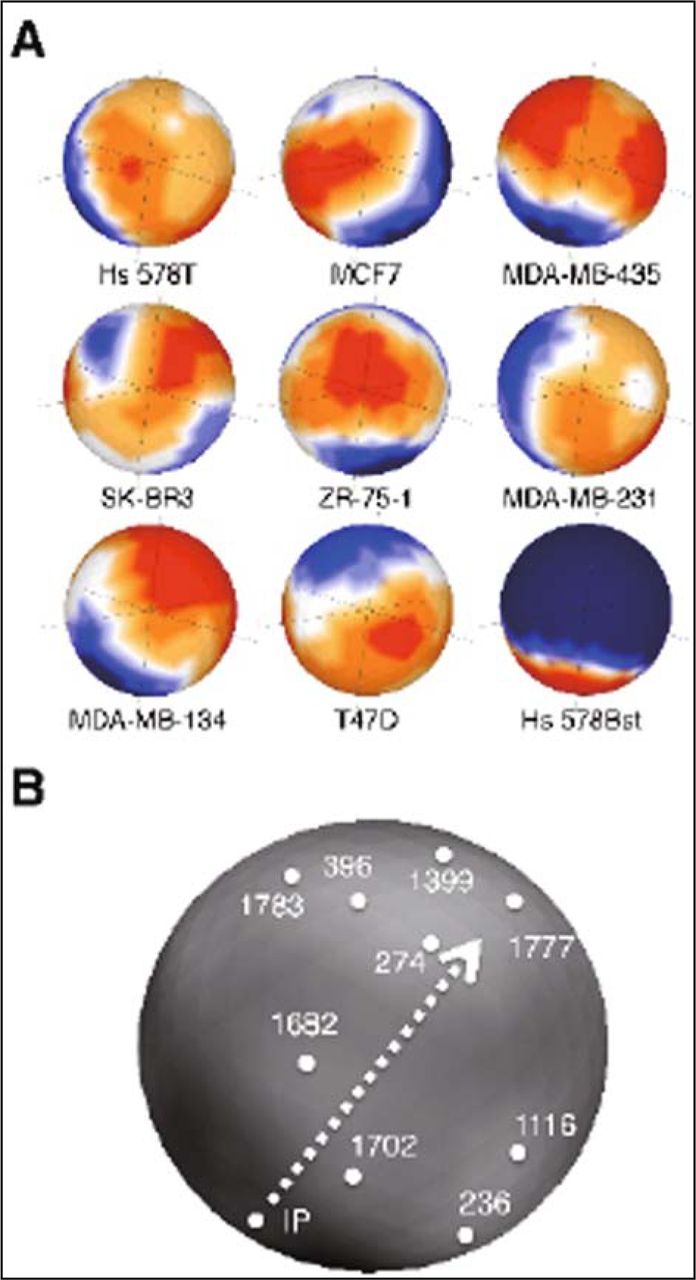
Gene expression profiles of breast carcinoma cells analyzed by sSOM. (A) Eight breast carcinoma derived cell lines and normal cell line were characterized by the 1,797 probes for membrane bound proteins on the DNA microarray. IP1×8,0 was put on the center of each map. The colors indicate the expression level for each gene. Red, high; yellow, slightly high; white, median; light blue, slightly low; deep blue, low. See Table 1 for the names of cell lines. (B) Locations of the ideal point “IP” and the spots, which were supposed closely related to IP are indicated. The numbers of spots correspond to probe nos. summarized in Table 2. The genes in the spots are summarized in Table 1. Arrowhead with broken line shows the direction of tracking spots from “IP” to “274” and “1777” (see “Results” and “Discussion” in detail).
Nomination of cell surface markers of breast cancer
The spots close to the IP1×8,0 were then selected by calculating the differences of RFIs as described in the “Materials and Method”. As the result, 45 genes were picked up and analyzed by Blossom to show the relationship of the genes on the sphere surface (Fig. 1B). In this analysis, IP was the virtual gene with the highest value of differences (i.e. one) between each carcinoma cell lines and normal cell line, so that the best candidate genes should appear close to the IP. However, the direction of the screening should be also important to pick up the best candidate as described previously[10]. Taking this point into consideration, 9 genes were picked up from the surface containing CD24 and ErbB3, of which expression in breast carcinomas were extensively described[3,13-19], and listed in Table 2. The orientation of the sphere surface in Fig. 1B was selected to show these genes. The arrowhead with broken line in Fig. 1B shows the direction from IP to CD24 (No.274) and ErbB3 (No.1777).
Genes clustered by sSOM in Fig. 1B.
Confirmation of differential expression of genes
The expression of the genes clustered along the arrow drawn in Fig. 1B was evaluated by PCR procedures. First, the genes corresponding to the nos. 1702 (TM9SF2), 1682 (TRPC5), 274, 1777, and 1399 (ROBO2) were analyzed by RT-PCR. As the result, the expression of TM9SF2, CD24 and ErbB3 were confirmed (Fig. 2A) while the expression of TRPC5 and ROBO2 were not observed (data not shown). As for the amplification of TRPC5 and ROBO2, it still remains to be analyzed further because the design of primers might be a reason why the amplification failed to show the bands. Expression of TM9SF2, CD24 and ErbB3 were further verified by real-time qPCR (Fig. 2B). The results of both PCR procedures were almost consistent with each other. It is interesting to note that TM9SF2, which was the closest to IP, was found to be expressed in all of the carcinoma cell lines assessed and upregulated in these cells when compared with the normal cell line. Although they could be attributed to the overexpression in breast carcinoma cells, CD24 and ErbB3 were expressed in 7 and in 6 out of 8 cell lines, respectively. These results were also consistent because CD24 and ErbB3 were far apart from IP and TM9SF2 in Fig. 1B.

Gene expression analysis of TM9SF2, CD24 and ErbB3. (A) Gel electrophoresis of reverse transcribed PCR products of TM9SF2, CD24, ErbB3 and GAPDH. (B) Relative gene expression levels analyzed by real-time qPCR. Vertical axes are expressed represent N-fold relative to that of normal cell line Hs 578Bst. The statistical significance (*) was calculated P < 0.01 by the student’s. Lanes 1, MCF7 cells; 2, T-47D cells; 3, SK-BR-3 cells; 4, ZR-75-1 cells; 5, MDA-MB-231 cells; 6, MDA-MB-435 cells; 7, MDA-MB-134 cells; 8, Hs 578T cells; 9, Hs 578Bst cells.
Localization of target proteins
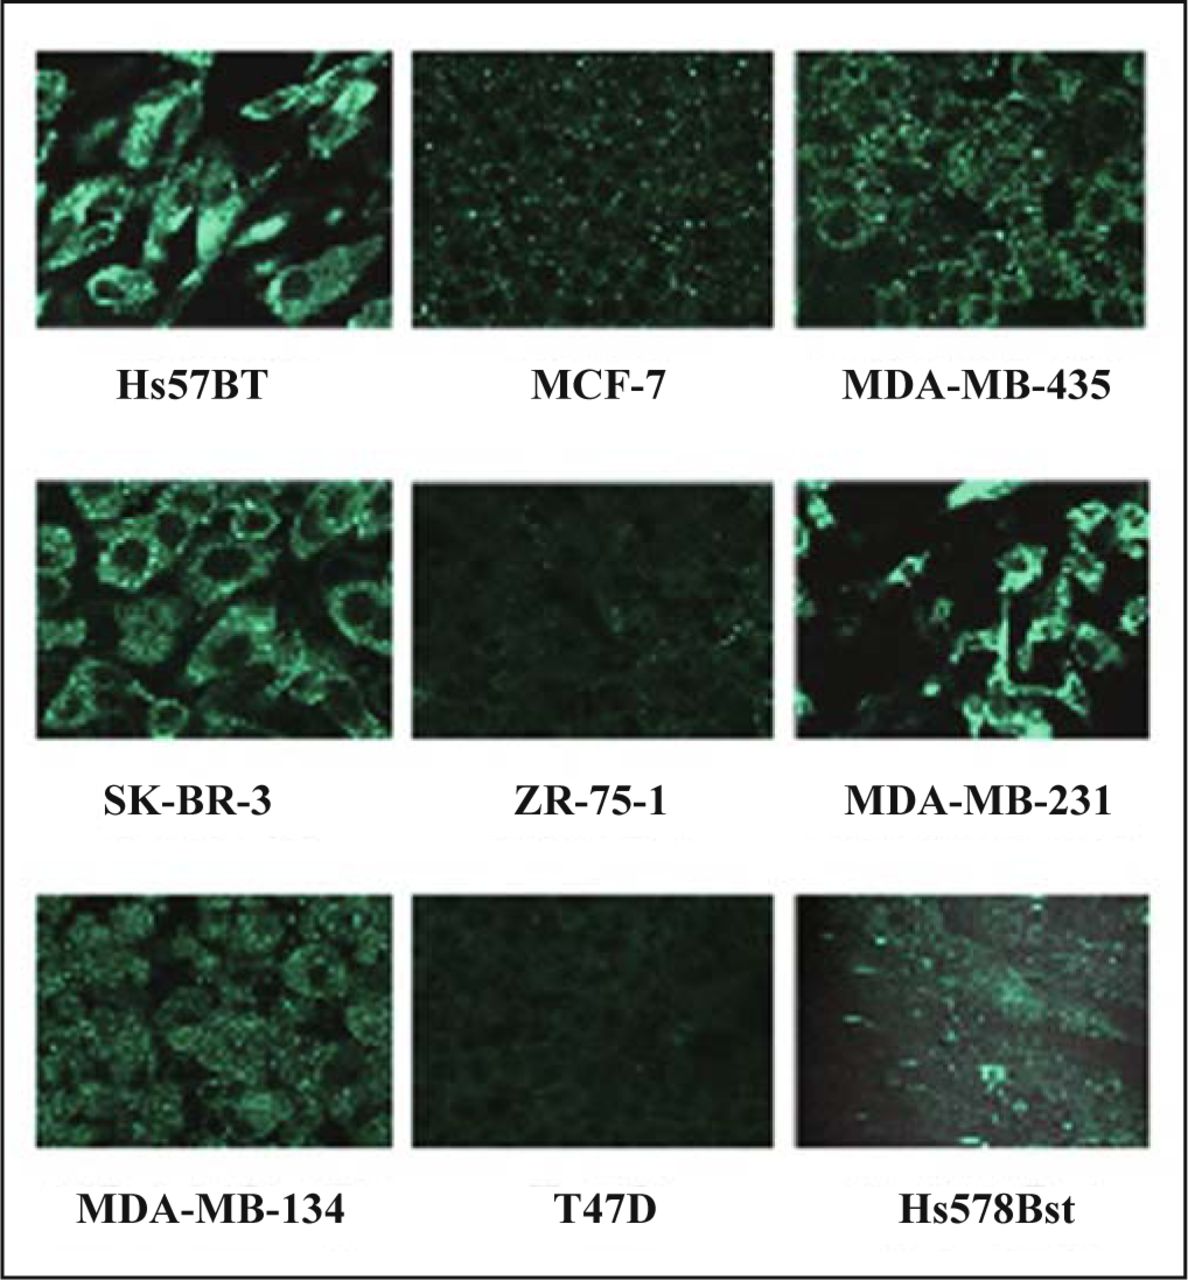
The translation of TM9SF2 was evaluated by immunocytochemistry on all the cell lines used in this study (Fig. 3). Comparing the immunoreactivity to anti-TM9SF2 antibody with the results from PCR procedures (Fig. 2), some discrepancies could be found. From PCR ZR-75-1 cells showed the highest expression and T47D, SK-BR-3 and MDA-MB-231 cells showed middle. In contrast, immunofluorescence detected from T47D and ZR-75-1 cells was the lowest among the cells used in this study. SK-BR-3, MDA-MB-231 and Hs578T cells showed significantly strong immunoreactivity. These inconsistencies between mRNA and protein levels might suggest cell-specific variations in posttranscriptional regulation of TM9SF2 expression or in turnover of TM9SF2 protein.

Immunostaining of TM9SF2 in breast carcinoma cell lines and normal cell line Hs 578Bst. Cells grown on coverslips were fixed and stained with antibodies against TM9SF2. Confocal images were taken with magnification of × 63.
Effect of TM9SF2 suppression on MDA-MB-231 cell proliferation
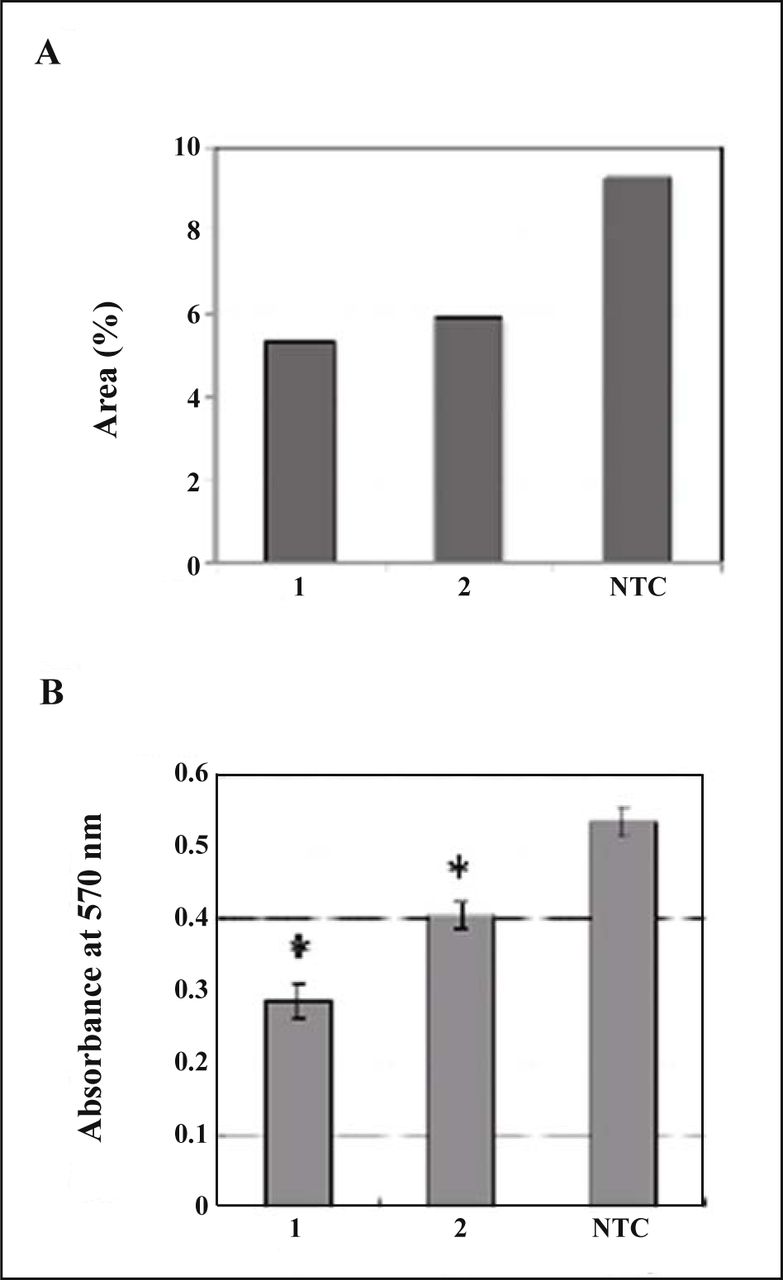
Since MDA-MB-231 cells showed significant immunoreactivity to the antibody against TM9SF2 (Fig. 3), the effect of suppression of TM9SF2 was evaluated. First of all, two sequences of siRNA were assessed for the inteference of TM9SF2 expression by immunocytochemistry due to the inefficiency of the antibody in western blotting. The fields at equivalent confluence were chosen and immunologically positive area of each field was calculated and compared (Fig. 4A). As the result, treatment by the siRNA showed decreased area of fluorescence implying the interference effect. Then the effect of siRNA treatment was evaluated on the proliferation of cells. Significant suppression of cell proliferation by the siRNAs was observed (Fig. 4B). siRNA1 was apparently more effective to suppress cell proliferation than siRNA2. This is consistent with the observation of decreased immunoreactive area of TM9SF2 when transfected with each siRNA (Fig. 4A).

Effect of TM9SF2 siRNA on MDA-MB-231 cells. (A) Fixed cells were stained with antibodies against TM9SF2 after siRNA transfection. Areas of green fluorescence relative to total areas of cells in each typical confocal image were calculated as percentages (see detail in “Materials and Methods”). (B) Cell proliferation assessed by MTT assay. Data represent means from seven replicates with SD. The statistical significance (*) was calculated P < 0.05 by Student’s t test. 1, siRNA1; 2, siRNA2; NTC, non-targeting control of AllStar negative control siRNA.
Discussion
To identify differentially expressed cell surface biomarkers in breast carcinoma cells, we analyzed gene expression profiles of eight human breast cancer cell lines together with a normal breast cell line. We employed sSOM to visualize the gene expression profiles on a sphere surfaces. From the patterns in Fig. 1A, the presence of genes, of which expression is presumably high in carcinoma derived cell lines while low or absent in the normal cell line, could be noticed since the sphere surface of Hs 578Bst is almost depicted in dark blue. After clustering 45 genes, which were picked up from the extensive data filtering, several genes including CD24 and ErbB3 were nominated as listed in Table 2. CD24 is a small, heavily glycosylated cell-surface protein, which is linked to the membrane via a GPI-anchor and therefore localizes in lipid rafts[20]. Fogel et al.[21] described CD24 expression as a marker of breast cancer. CD24 protein expression was further described as a prognostic marker in breast cancer[3] important for progression, migration and metastasis of human breast cancer[13,14]. ErbB3 (also known as HER3) is one of the EGF receptors, which regulates the growth, differentiation and survival of human breast epithelial cells[15]. Overexpression of ErbB3 has been noted in breast cancer[16-19]. The prevalence of ErbB3 expression has been reported to be between 17%~52% as judged by mRNA[20,21] or protein levels[17,22,23]. With this information of CD24 (274) and ErbB3 (1777) we determined the direction of analysis from IP as shown by the arrow in Fig. 1B. TM9SF2 (1702), which was the closest to the arrow and IP, was nominated as the candidate on the sphere surface. RT-PCR and RT-qPCR results demonstrated that TM9SF2 expression was more common than that of CD24 and ErbB3 among the carcinoma cell lines (Fig. 2). This is a credit that supports the validity of TM9SF2 as a marker of breast cancer cells. However, the protein expression of TM9SF2 assessed by the immunoreactivity in the carcinoma cell lines was inconsistent with the results of PCR. TM9SF2, which is proposed to function as channel or small molecule transporter[24], is a member of the transmembrane 9 (TM9) family characterized by the presence of a large variable extracellular N-terminal domain followed by 9 putative transmembrane domains in their conserved C termini. Since the genomic sequence coding the N-terminal extracellular domain consists of 8 exons, posttranscriptional events such as an “alternative splicing” may explain the weak immunoreactivity inconsistent with the results of PCR.
Although the physiological significance of TM9 proteins is essentially unknown, function as channel, small molecule transporter[24] or adhesion receptor[25] has been proposed. To relate TM9SF2 to the growth of carcinoma cells, we silenced TM9SF2 expression by siRNA. Transfection of siRNA significantly suppressed the cell growth of MDA-MB-231 cells, suggesting that up-regulation of TM9SF2 might promote the growth or survival of carcinoma cells.
In this study, we could successfully identify and validate TM9SF2 as a novel candidate of cell surface marker commonly expressed in breast cancer cells. Although further investigation on the relationship between overexpression of TM9SF2 and tumor growth as well as malignancy should be required, the molecular targeting of TM9SF2 for cancer therapy would be the goal to be pursued.
Acknowledgements
The authors thank Mr. H. Umeno for excellent assist for the design of oligo-nucleotide probes, Drs. T. Hashizume, M. Tanga, Mrs. M. Okada, K. Hirayama, Prof. H. Yamada, Asc. Prof. J. Futami, and Ass. Prof. H. Tada for their invaluable discussion, helpful suggestions, and technical support throughout the study.
Footnotes
This work was partly supported by the Grantin-Aid for scientific research (B) No.18300164 “Screening of carcinoma cell surface markers and its application in molecular targeting with bionanocapsules” from Japan Society for the Promotion of Science (JSPS).
- Revision received December 1, 2008.
- Accepted January 14, 2009.
- Copyright © 2009 by Tianjin Medical University Cancer Institute & Hospital and Springer
References
In this issue


Jump to section
Related Articles
Cited By...
- No citing articles found.