
Abstract
Objective: Glioblastoma (GBM) is the most common primary malignant brain tumor regulated by numerous genes, with poor survival outcomes and unsatisfactory response to therapy. Therefore, a robust, multi-gene signature-derived model is required to predict the prognosis and treatment response in GBM.
Methods: Gene expression data of GBM from TCGA and GEO datasets were used to identify differentially expressed genes (DEGs) through DESeq2 or LIMMA methods. The DEGs were then overlapped and used for survival analysis by univariate and multivariate COX regression. Based on the gene signature of multiple survival-associated DEGs, a risk score model was established, and its prognostic and predictive role was estimated through KaplanMeier analysis and log-rank test. Gene set enrichment analysis (GSEA) was conducted to explore high-risk score-associated pathways. Western blot was used for protein detection.
Results: Four survival-associated DEGs of GBM were identified: OSMR, HOXC10, SCARA3, and SLC39A10. The four-gene signature-derived risk score was higher in GBM than in normal brain tissues. GBM patients with a high-risk score had poor survival outcomes. The high-risk group treated with temozolomide chemotherapy or radiotherapy survived for a shorter duration than the low-risk group. GSEA showed that the high-risk score was enriched with pathways such as vasculature development and cell adhesion. Western blot confirmed that the proteins of these four genes were differentially expressed in GBM cells.
Conclusions: The four-gene signature-derived risk score functions well in predicting the prognosis and treatment response in GBM and will be useful for guiding therapeutic strategies for GBM patients.
- Differentially expressed genes
- gene set enrichment analysis
- glioblastoma prognosis
- radiotherapy
- temozolomide chemotherapy
Introduction
Glioblastoma (GBM), which belongs to the World Health Organization (WHO) grade IV glioma, is the most common and aggressive primary malignant brain tumor1,2. Despite advances in surgical resection, radiotherapy, and chemotherapy, the prognosis of GBM patients remains dismal, with a median survival time of less than 15 months3,4. This poor outcome is attributable to malignant progression, drug resistance, and tumor recurrence, which are regulated by numerous oncogenes and tumor suppressor genes5,6. Therefore, a multiple-gene signature derived model is warranted for predicting the prognosis and treatment response more accurately and for more efficient management of GBM.
Recently, data-mining and bioinformatics analysis has been a powerful and promising tool in cancer research. A lot of high-throughput data generated by microarrays and next-generation sequencing are collected in public databases, of which The Cancer Genome Atlas (TCGA) and Gene Expression Omnibus (GEO) are the most widely used. Mining these data can be very helpful in exploring tumor expression characteristics and identifying prognostic indicators and predictive biomarkers7-9.
In the present study, we aimed to conduct a combination analysis on the gene expression data of GBM from TCGA and GEO to identify the survival-associated differentially expressed genes (DEGs), thereby establishing a risk model based on the gene signature of these identified genes for prognosis and treatment response prediction. We identified four aberrantly expressed genes in GBM that were significantly associated with survival. The risk score model based on the four-gene signature functioned well for estimating the prognosis and treatment response, and the high-risk score was enriched with multiple tumor-associated pathways. Our results demonstrate that the four-gene signature-derived risk score model can predict the prognosis and treatment response in GBM patients.
Materials and methods
Acquisition of gene expression data of GBM from TCGA and GEO databases
The non-normalized gene expression data of TCGA GBM generated by the Illumina HiSeq 2000 RNA sequencing platform, shown as counts, which were required for the subsequent DEseq2 analysis10, were downloaded from the TCGA official website ( https://cancergenome.nih.gov/), while the corresponding normalized data, shown as log2(x+1) transformed RSEM normalized counts, which were used for correlation analysis, survival analysis, and gene set enrichment analysis, were obtained from the TCGA hub in UCSC Xena ( https://tcga.xenahubs.net). The GBM samples from TCGA after removing those without survival time formed the 165 cases for this study (Supplementary Table S1). Use of the TCGA data adhered to TCGA publication guidelines and policies. The microarray data of GEO GBM (GSE4290, GSE16011, GSE43378, GSE83300 and GSE90604) were acquired from the GEO official website ( http://www.ncbi.nlm.nih.gov/geo) and normalized using the RMA method11,12, whereas the normalized RNA sequencing data of GSE59612 were directly downloaded from the GEO website. These normalized GEO data were used for LIMMA analysis and survival analysis. The clinical information of GBM patients from TCGA database and GEO database is summarized in Supplementary Table S2 and Table S3 respectively.
TCGA samples used in the study
The clinical characteristics of GBM patients in TCGA cohort
The clinical information of GBM patients from GEO database
Exploration of DEGs of GBM
For mRNA sequencing data of GBM from TCGA database, the R language package DEseq2 was used to identify DEGs between GBM and normal brain tissue10. For the mRNA microarray data of GBM from GEO database, the R language package LIMMA was applied to explore DEGs in GBM compared to the normal brain tissue13. Genes with adjusted p values below 0.05 and the absolute value of fold change above 2 were referred as DEGs in GBM. To search for the common and robust DEGs of GBM, we overlapped the upregulated genes in the TCGA GBM cohort, GSE4290 and GSE16011, and also overlapped the downregulated genes in these cohorts.
Survival analysis of the overlapped DEGs in GBM
To evaluate whether the overlapped DEGs were associated with survival, univariate Cox proportional hazards regression analysis of each of them for overall survival in TCGA GBM cohort was conducted. Subsequently, the upregulated genes inversely correlated with survival (P < 0.01) and the downregulated genes positively correlated with survival ( P < 0.01) were further analyzed through multivariate Cox proportional hazards regression to identify the key DEGs associated with survival.
Establishment of the risk score model for prognosis and treatment response prediction
Based on the gene signature of survival-associated DEGs identified via multivariate Cox proportional hazards regression analysis, a risk score model was established with the following formula.

In the above equation, n is the total number of key genes; i represents the regression coefficient of gene i; and Ei represents the expression value of gene i. In the validation GEO datasets, i used was the same as that in the TCGA cohort.
To explore the prognostic and predictive role of risk score, GBM patients were divided into high-risk and low-risk groups according to the cutoff of risk score determined by the receiver operating characteristic curve analysis. Then the two groups in all GBM patients, or the patients with therapy were analyzed for survival using the Kaplan-Meier method with the log-rank test. Univariate and multivariate Cox regression analysis of clinicopathological parameters and risk score were conducted to confirm the clinical significance of the risk score.
Gene set enrichment analysis (GSEA)
GSEA was conducted to explore the high-risk score associated signaling pathways on GSEA software downloaded from the Broad Institute ( http://www.broadinstitute.org/gsea)14. The gene expression data of the high-risk and low-risk groups in TCGA GBM cohort together with the gene sets in Hallmark, and C2.CP and C5.BP MSigDB datasets from the Broad Institute were imported into the GSEA software. By running GSEA, normalized enrichment scores and p-value were generated. The Cytoscape software with the Enrichment map plug-in was used for visualizing the GSEA results15.
Cell culture
The normal human glial cell line HEB was kindly provided by Prof. Guang-Mei Yan (Department of Pharmacology, Sun Yat-Sen University, Guangzhou, China)16. Human GBM cell line LN229 was from the American Type Culture Collection (ATCC) (Manassas, Virginia) and authenticated by short tandem repeat testing (Beijing Microread Genetics Co., Ltd., Beijing, China)17. Primary human GBM cells, GBM-1 and GBM-2, were established using two surgical specimens from GBM patients at the Department of Neurosurgery, Southwest Hospital with written informed consent18, which was in accordance with the Declaration of Helsinki and was approved by the Ethics Committee of the Southwest Hospital. The information of the two GBM specimens is summarized in Supplementary Table S4. For primary GBM cell culture, the specimens were cut into 1 ՠ1ՠ1 mm3 pieces and cultured in 0.2 ml FBS (Hyclone, GE Healthcare Bio-Sciences, Pittsburgh, Pennsylvania) in a 60 mm dish inverted for 1 h. The dish was then turned the right side up and supplemented with 5 ml DMEM (Hyclone) containing 10% FBS (Hyclone). The primary GBM cells were detached with 0.25% trypsin upon formation of a monolayer of cells. All the cells were maintained in DMEM (Hyclone) supplemented with 10% FBS (Hyclone) without mycoplasma contamination, and incubated at 37°C in a humidified incubator with 5% CO2/95% air.
The clinical information of GBM specimens used for establishment of primary GBM cells
Western blot
Western blot analysis was carried out as described previously16. Antibodies used in western blot are listed as follows: anti-OSMR (Abcam, ab210771, 1 : 1000) (Cambridge, United Kingdom), anti-HOXC10 (Abcam, ab153904, 1 : 1000), anti-SCARA3 (Abcam, ab96205, 1 : 000), anti-SLC39A10 (Abcam, ab83947, 1 : 1000), anti-ݭActin (Cell Signaling Technology, #8457, 1 : 1000) (Danvers, Massachusetts), and horseradish peroxidase-conjugated anti-rabbit IgG (Cell Signaling Technology, #7074, 1 : 5000). The relative expression of target proteins was quantified in comparison with ݭActin using Image Lab software (Bio-Rad Laboratories, Berkeley, California) and was then normalized to the corresponding expression in HEB cells.
Statistical analysis
Unpaired Students t-test and MannWhitney U test were used to compare two groups, whereas one-way ANOVA and Kruskal-Wallis H test were used to compare multiple groups. Pearson Chi-Square test and Fishers exact test were conducted to analyze the correlation between risk score and clinicopathological parameters. Experiments were conducted independently three times and data were presented as mean ± SEM. P < 0.05 (*), P < 0.01 (**), and P < 0.001 (***) were considered statistically significant. All statistical analyses were performed on SPSS 19.0 (IBM, Armonk, New York), Graphpad Prism 6.0 (GraphPad Software, La Jolla, California), or R software (www.r-project.org).
Results
Multiple differentially expressed genes in GBM
Three GBM datasets (TCGA, GSE4290 and GSE16011) were used to identify the DEGs in GBM compared to normal brain tissues. As shown in Figure 1A, there were 3881 upregulated genes and 3908 downregulated genes in TCGA GBM dataset, 1048 upregulated genes and 1443 downregulated genes in the GSE4290 dataset, and 1705 highly expressed genes and 1440 low expressed genes in the GSE16011 cohort (Figure 1A). Overlapping the DEGs from three GBM cohorts resulted in 483 upregulated genes and 765 downregulated genes (Figure 1B), which could clearly discriminate GBM and normal brain tissues (Figure 1C). Collectively, these data demonstrate that there are multiple DEGs in GBM compared to normal brain tissue.
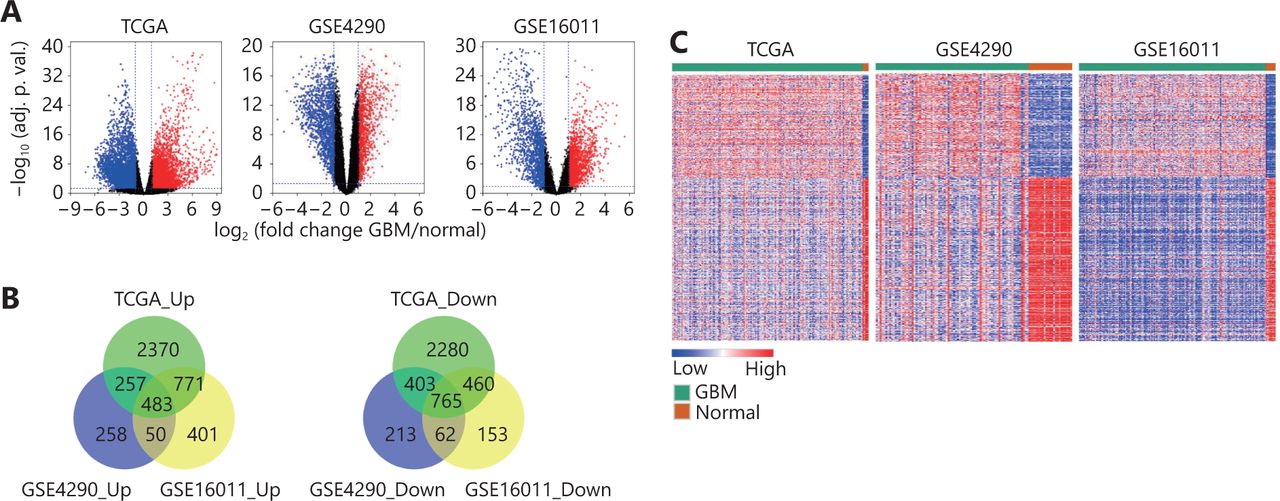
Differentially expressed genes between GBM and normal brain tissues. (A) Volcano plots showing the log2 (fold change) of mRNA in GBM compared to normal brain tissues, and the correspondinglog10 (adjusted P value) in TCGA, GSE4290 and GSE16011 datasets. Genes with adjusted P value below 0.05 and fold change above 2 (below -2) were marked with red (blue) dots. (B) Venn diagrams showing the gene numbers of the upregulated genes (left) and the downregulated genes (right) of GBM in TCGA, GSE4290 and GSE16011 cohorts. (C) Heatmaps of the overlapped genes in TCGA, GSE4290 and GSE16011 datasets. The overlapped genes that are from Figure 1B include 483 upregulated genes and 765 downregulated genes.
Survival analysis of the overlapped DEGs
To evaluate the prognostic significance of the overlapped DEGs in GBM, univariate Cox regression analysis of each for overall survival was conducted. As shown in Table 1, 15 upregulated genes inversely correlated with survival and 3 downregulated genes positively correlated with survival were identified (P < 0.01) ( Table 1). Subsequently, multivariate stepwise Cox regression analysis of these 18 genes was applied and 4 genes were eventually proved to be correlated with overall survival (Table 1). These 4 genes are oncostatin M receptor (OSMR), homeobox C10 (HOXC10), scavenger receptor class A member 3 (SCARA3), and solute carrier family 39 member 10 (SLC39A10). Among these, OSMR, HOXC10, and SCARA3 were highly expressed in GBM and inversely correlated with survival (ݠ> 0, HR > 1), whereas SLC39A10 was lowly expressed and positively correlated with survival (ݠ< 0, HR < 1) ( Table 1). Taken together, these data suggest that the four key DEGs of GBM are significantly correlated with the overall survival of GBM patients.
Univariate and multivariate Cox regression analysis of the overlapped DEGs of GBM
The four-gene signature-derived risk score model predicts the survival and treatment response in TCGA GBM cohort
As GBM is regulated by multiple genes, we established a risk score model based on the gene expression signature of the four key DEGs to predict survival. The calculation formula of risk score is listed as follows: risk score = OSMR*EOSMR + HOXC10*EHOXC10 + SCARA3*ESCARA3 + SLC39A10*ESLC39A10. ߔ is the regression coefficient derived from multivariate COX stepwise regression analysis based on TCGA GBM cohort and E represents the expression value of the corresponding gene (Figure 2A). Compared to normal brain tissue, the risk score was higher in GBM (Figure 2B). Analysis of the correlation between the risk score and clinicopathological characteristics showed that a high-risk score was positively correlated with IDH-wild type (Figure 2A and 2C, Supplementary Table S5), and mesenchymal subtype (Figure 2A and 2D, Supplementary Table S5). The IDH-wild type or mesenchymal subtype GBM was associated with unfavorable outcome (Figure S1), which was also demonstrated in previous studies7,19, suggesting that a high-risk score might be related to poor prognosis.

The four-gene signature-derived risk score is high in GBM. (A) The calculation formula and the value of risk score (top), the corresponding expression of four key genes (middle), and the associated clinicopathological parameters (bottom). ߔ indicates the regression coefficient derived from multivariate COX stepwise regression in TCGA GBM cohort; E represents the expression value of the corresponding gene. The P-value indicates the correlation between the risk score and the clinicopathological parameters (Supplementary Table S5). KPS, Karnofsky performance status; IDH, isocitrate dehydrogenase; MGMT, O(6)-methylguanine-DNA methyltransferase; NA, not available. (B-D) Risk scores in GBM and normal brain tissues (B), in IDH-wt GBM and IDH-mut GBM (C), and in mesenchymal GBM and non-mesenchymal (proneural and classical) GBM (D) in TCGA GBM cohort. IDH, isocitrate dehydrogenase; IDH-wt, IDH-wild type; IDH-mut, IDH-mutation. Data are shown as mean ± SEM, *P < 0.05, *** P < 0.001, ns, not significant.
Correlation between the risk score and clinicopathological parameters in TCGA GBM cohort
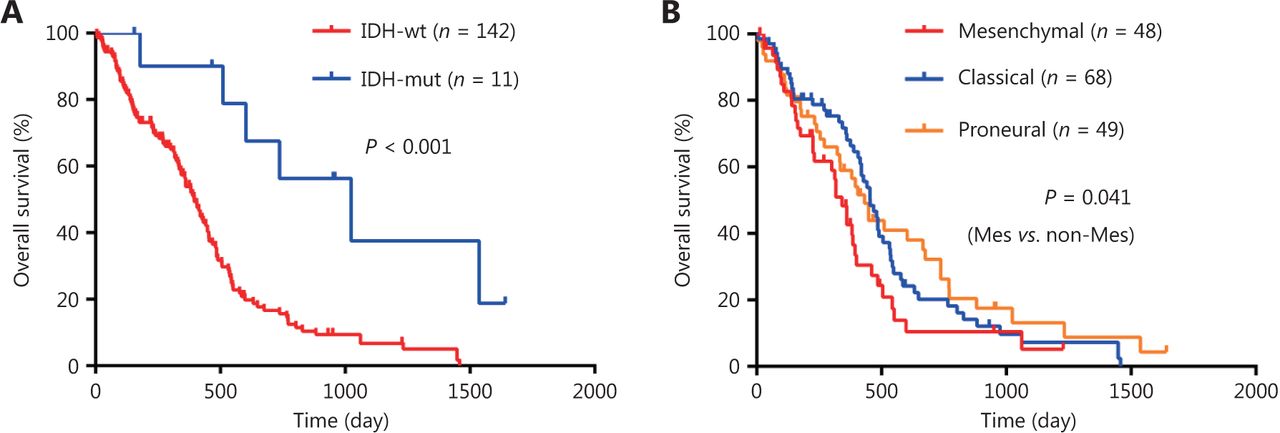
Survival analysis of GBM patients. (A-B) Kaplan-Meier overall survival analysis of GBM patients stratified by IDH status (A), and expression subtypes (B). IDH, isocitrate dehydrogenase; IDH-wt, IDH-wild type; IDH-mut, IDH-mutation. Mes, mesenchymal; Non-Mes, non-mesenchymal, including proneural and classical subtypes.
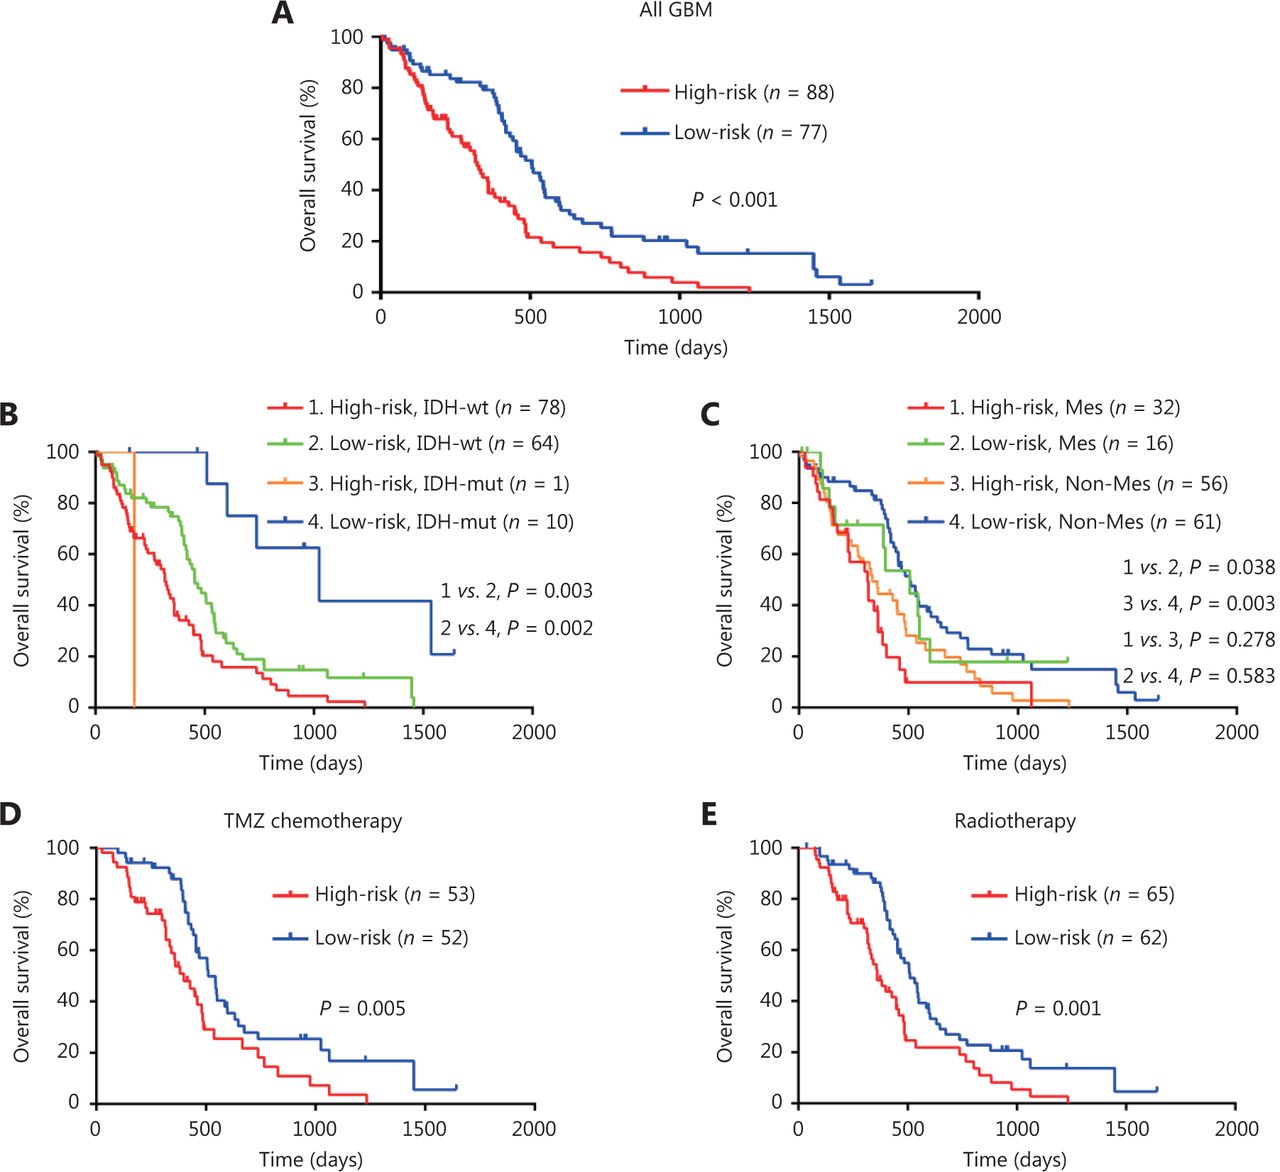
To confirm the prognostic significance of the risk score, Kaplan-Meier survival analyses of high-risk and low-risk GBM patients were conducted. As shown in Figure 3A, high-risk GBM patients survived shorter compared to low-risk patients (Figure 3A). Survival analysis by a combination of risk score and IDH status showed that GBM patients with high-risk score and IDH-wild type had the worst outcomes (Figure 3B), and survival analysis by a combination of risk score and expression subtypes revealed that GBM patients in the mesenchymal subgroup (or in non-mesenchymal subgroup) with a high-risk score had a shorter survival time than those in the mesenchymal subgroup (or in non-mesenchymal subgroup) with a low-risk score (Figure 3C). The prognostic significance of the risk score was further validated through univariate and multivariate analysis (Supplementary Table S6). Furthermore, high-risk score was also correlated with poor outcome in GBM patients treated with temozolomide chemotherapy or radiotherapy (Figure 3D and 3E), suggesting that the risk score could predict the treatment response. Taken together, these data demonstrate that the risk score model can predict the prognosis as well as the response to therapy in GBM patients.

Risk score predicts the prognosis and treatment response in TCGA GBM cohort. (A-C) KaplanMeier overall survival analysis among TCGA GBM patients stratified by risk score only (A), combined with IDH status (B), and combined with expression subtypes (C). Mes, mesenchymal; Non-Mes, non-mesenchymal, including proneural and classical subtypes. (D-E) KaplanMeier overall survival analysis of TCGA GBM patients with TMZ chemotherapy (D), or radiotherapy (E) according to the risk score. TMZ, temozolomide.
Univariate and multivariate Cox regression analysis of clinicopathological parameters and risk score for overall survival in TCGA GBM cohort
Risk score model predicts the prognosis and treatment response among independent GEO cohorts of GBM
To further validate the prognostic and predictive role of risk score, the value of the risk score in GBM compared to the normal brain tissue was evaluated and Kaplan-Meier survival analysis was conducted in independent GEO datasets of GBM. As shown in Figure 4A and 4B, the risk score in GBM was higher than that in normal brain tissues (Figure 4A), and GBM patients with a high-risk score had a shorter survival time (Figure 4B). High-risk score was also correlated with poor outcome in GBM patients who underwent radiotherapy (Figure 4C). Combination analysis of the risk score and expression subtypes revealed that the risk score was the highest in mesenchymal GBM, and that mesenchymal GBM patients with a high-risk score had a shorter survival time compared to those with a low-risk score (Figure 4D). Combination analysis of the risk score and IDH status showed that GBM patients with IDH-mutation and a high-risk score had a poor outcome compared to those with IDH-mutation and a low-risk score, whereas there was no statistically significant difference in survival between GBM patients in the IDH-wild type subgroup with a high-risk score and those in the IDH-wild type subgroup with a low-risk score (Figure 4E), possibly due to the small sample size and tumor heterogeneity. Taken together, these data confirm that the risk score model can be applied to predict the prognosis and treatment response of GBM patients.

Performance of risk score in predicting the survival and treatment response in independent GEO GBM cohorts. (A) Comparison of risk scores between GBM and normal brain tissues in GSE4290, GSE16011, GSE59612 and GSE90604. (B) Kaplan-Meier overall survival analysis of high-risk and low-risk GBM patients in GSE16011, GSE43378 and GSE83300. (C) Kaplan-Meier overall survival analysis of GBM patients with radiotherapy in GSE16011 according to the risk score. (D) Risk scores in mesenchymal GBM and non-mesenchymal (proneural and classical) GBM (up), and KaplanMeier overall survival analysis of GBM patients stratified by risk scores combined with expression subtypes (down). Mes, mesenchymal; Non-Mes, non-mesenchymal, including proneural and classical subtypes. (E) Risk scores in IDH-wt GBM and IDH-mut GBM (up), and KaplanMeier overall survival analysis of GBM patients stratified by risk scores combined with IDH status (down). IDH, isocitrate dehydrogenase; IDH-wt, IDH-wild type; IDH-mut, IDH-mutation. Data are shown as mean ± SEM, *P < 0.05, ** P < 0.01, *** P < 0.001, ns, not significant.
The high-risk score is enriched with multiple tumor-associated pathways
The four-gene signature-derived risk score in prognosis and treatment response prediction may be closely correlated with some important signaling pathways. Thus, we conducted GSEA analysis among high-risk and low-risk patients to identify the pathways associated with the four-gene signature. As shown in Figure 5, multiple tumor-associated pathways such as vasculature development, cell adhesion, response to oxidative stress, intracellular signal transduction, and so on, were enriched in GBM patients with a high-risk score (Figure 5).
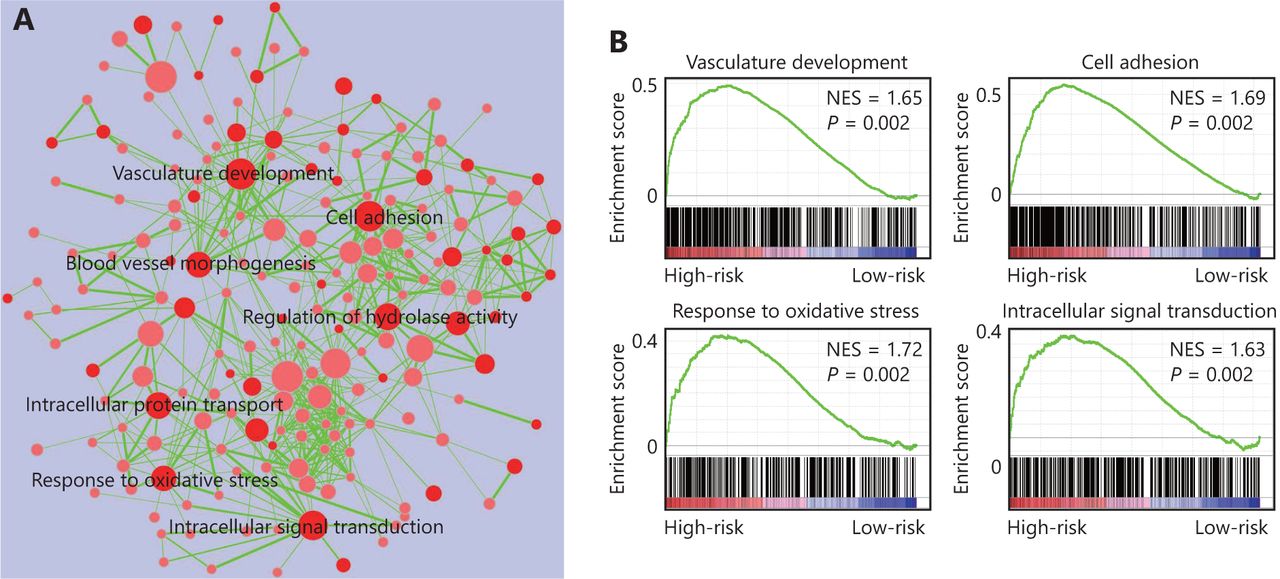
Four-gene signature associated biological pathways in high-risk GBM. (A) Enrichment map showing the pathways enriched in high-risk GBM through GSEA analysis. Nodes represent enriched gene sets with P-value below 0.05. Node with deep red color correlates with small P-value. Node size corresponds to the number of genes within gene set. Edge thickness corresponds to the number of shared genes between gene sets. (B) Representative enriched pathways in high-risk GBM through GSEA analysis. NES, normalized enrichment score.
Validation of the differential expression of the four genes in GBM cells
To further validate the differential expression of the four genes (OSMR, HOXC10, SCARA3 and SLC39A10) in GBM, we conducted Western blot analysis to detect the corresponding proteins of these four genes in a GBM cell line, primary GBM cells, and in a normal glial cell line. As shown in Figure 6, OSMR, HOXC10, SCARA3 were highly expressed by GBM cells compared to the normal glial cell line, whereas SLC39A10 was lowly expressed (Figure 6). Taken together, these data confirm that the four genes are differentially expressed by GBM cells.

Validation of the differential expression of the four genes in GBM cells. (A and B) Western blot images (A) and the relevant quantification (B) of OSMR, HOXC10, SCARA3 and SLC39A10 in GBM cell line LN229, primary GBM cells (GBM-1 and GBM-2), and normal glial cell line HEB. The relative expression of target proteins is quantified in comparison with ݭActin and normalized to the corresponding expression in HEB cells. Data are shown as mean ± SEM from three independent experiments, *P < 0.05, ** P < 0.01, *** P < 0.001.
Discussion
GBM is characterized with a complex molecular background5,20, and abundant high-throughput data regarding GBM facilitate exploration of prognostic and predictive molecular biomarkers. In the current study, by combination analysis of multiple gene expression data of GBM from TCGA and GEO cohorts, we uncovered four key genes (OSMR, HOXC10, SCARA3, and SLC39A10) that are aberrantly expressed in GBM and are also associated with survival. The four-gene signature-derived risk score model functions well in predicting the prognosis and treatment response of GBM patients. Moreover, the high-risk score is enriched with multiple tumor-associated pathways.
The initial step of our study was to screen out the DEGs of GBM by combination analysis of gene expression data from both TCGA and GEO datasets, rather than based on just one GBM dataset. In this way, the discovered genes (483 up-regulated and 765 down-regulated) might be stably and specifically expressed in GBM compared to normal brain tissue. We then conducted univariate and multivariate Cox regression analysis of the DEGs and found four important genes associated with survival, i.e., OSMR, HOXC10, SCARA3, and SLC39A10. Genes that are upregulated and inversely correlated with survival (OSMR, HOXC10, and SCARA3) may function as oncogenes, whereas SLC39A10, the gene that is downregulated and positively correlated with survival, may function as a GBM suppressor gene. Moreover, the proteins of these four genes were also differentially expressed in GBM cells as validated by western blot. Thus, the risk score model was established based on the signature of these four DEGs. According to previous studies, gene signatures comprising the expression of multiple genes are useful in reducing the complexity of tumor data, and are more static, robust, and reproducible in prognosis prediction, whereas the expression level of an individual gene may change in a very short period21. In our study, the four-gene signature-derived risk score could predict the survival outcome of GBM patients from TCGA cohort, and its prognostic role was reproducible in independent GEO datasets of GBM. Additionally, the risk score model could also predict the response of GBM patients to radiotherapy or chemotherapy. Thus, we established a promising multi-gene signature-derived risk score model that can be used as a prognostic and predictive biomarker in GBM.
Among the four genes, OSMR is a member of the interleukin 6 receptor family, which transduces oncostatin M (OSM)-induced signaling mainly through the JAK/STAT pathway and plays an important role in hematopoiesis, development, and inflammation as well as in tumor progression22. HOXC10 belongs to the homeobox gene family that encodes a family of highly conserved transcription factors. It is associated with cell proliferation, differentiation, and morphogenesis, and also has pro-tumoral functions in tumor growth, migration, invasion, metastasis, and drug resistance23,24. SCARA3 encodes a macrophage scavenger receptor-like protein, and its expression can be induced by oxidative stress and enables depletion of reactive oxygen species, thus, protecting cells from oxidative stress-induced cell killing25. SLC39A10 is a zinc transporter involved in zinc uptake26, whereas its role in GBM progression is poorly understood. The biological functions of these four genes have partially provided clues for understanding the prognostic and predictive significance of risk score, but the role of these genes in GBM progression and the underlying mechanisms need further investigation.
The prognostic and predictive value of the four-gene signature-derived risk score may be useful for guiding therapeutic strategies to improve the clinical outcome of GBM patients. Patients with high-risk scores should receive aggressive treatment, whereas those with low-risk scores should avoid additional treatment that could lead to unnecessary toxicities. Therefore, it is important to translate the risk score into clinical practice, though there is a long way to go. For clinical application, prospective clinical studies are warranted to further validate the prognostic and predictive significance of the risk score.
Conclusions
In conclusion, the four-gene signature-derived risk score model functions well in predicting the prognosis and treatment response in GBM patients, with the potential to optimize treatment decisions. Future studies are needed to explore the biological roles of these four genes in GBM progression and to further validate the prognostic and predictive value of the risk score for clinical practice.
Acknowledgements
This study was supported by the National Key R&D Program of China (Grant No. 2016YFA0101203 to XB and 2016YFC1201801 to XZ), the National Natural Science Foundation of China (Grant No. 81372273 and 81773145 to XZ), the funding from Key Laboratory of Tumor Immunology and Pathology (Army Medical University), Ministry of Education of China (Grant No. 2017jszl09 to MC) and the Basic and Applied Fund of First Affiliated Hospital of Army Military Medical University (Grant No. SWH2016BZGFSBJ-04 and SWH2016JCZD-04 to XZ).
Footnotes
Conflict of interest statement No potential conflicts of interest are disclosed.
- Received August 22, 2018.
- Accepted December 10, 2018.
- Copyright: © 2019, Cancer Biology & Medicine
This is an open access article distributed under the terms of the Creative Commons Attribution License (CC BY) 4.0, which permits unrestricted use, distribution and reproduction in any medium, provided the original author and source are credited.
References
- 1.
- 2.
- 3.
- 4.
- 5.
- 6.
- 7.
- 8.
- 9.
- 10.
- 11.
- 12.
- 13.
- 14.
- 15.
- 16.
- 17.
- 18.
- 19.
- 20.
- 21.
- 22.
- 23.
- 24.
- 25.
- 26.