Article Text

Abstract
Objective ATM serine/threonine kinase (ATM) is the most frequently mutated DNA damage response gene, involved in homologous recombination (HR), in pancreatic ductal adenocarcinoma (PDAC).
Design Combinational synergy screening was performed to endeavour a genotype-tailored targeted therapy.
Results Synergy was found on inhibition of PARP, ATR and DNA-PKcs (PAD) leading to synthetic lethality in ATM-deficient murine and human PDAC. Mechanistically, PAD-induced PARP trapping, replication fork stalling and mitosis defects leading to P53-mediated apoptosis. Most importantly, chemical inhibition of ATM sensitises human PDAC cells toward PAD with long-term tumour control in vivo. Finally, we anticipated and elucidated PARP inhibitor resistance within the ATM-null background via whole exome sequencing. Arising cells were aneuploid, underwent epithelial-mesenchymal-transition and acquired multidrug resistance (MDR) due to upregulation of drug transporters and a bypass within the DNA repair machinery. These functional observations were mirrored in copy number variations affecting a region on chromosome 5 comprising several of the upregulated MDR genes. Using these findings, we ultimately propose alternative strategies to overcome the resistance.
Conclusion Analysis of the molecular susceptibilities triggered by ATM deficiency in PDAC allow elaboration of an efficient mutation-specific combinational therapeutic approach that can be also implemented in a genotype-independent manner by ATM inhibition.
- pancreatic tumours
- DNA damage
- drug resistance
- pancreatic cancer
- pancreas
Data availability statement
Data are available upon reasonable request.
This is an open access article distributed in accordance with the Creative Commons Attribution Non Commercial (CC BY-NC 4.0) license, which permits others to distribute, remix, adapt, build upon this work non-commercially, and license their derivative works on different terms, provided the original work is properly cited, appropriate credit is given, any changes made indicated, and the use is non-commercial. See: http://creativecommons.org/licenses/by-nc/4.0/.
Statistics from Altmetric.com
Significance of this study
What is already known on this subject?
ATM serine/threonine kinase (ATM) is eminent for DNA damage response by homologous recombination (HR).
ATM deficiency promotes epithelial-mesenchymal transition (EMT), genomic instability and dismal prognosis in pancreatic ductal adenocarcinoma (PDAC).
PARP inhibition is effective in ATM-deficient PDAC but causes early chemoresistance.
What are the new findings?
ATM deficiency triggers tremendous sensitivity to PARP, ATR and DNA-PKcs (PAD) inhibition therapy both in mouse and human model systems.
PAD demonstrates drug synergism allowing optimisation of therapeutic dosing.
ATM inhibition ascribes HR-defectiveness (HRDness) to PDAC.
Chemoresistance to PARP inhibition in ATM-deficient PDAC is caused by upregulation of multidrug resistance transporters and EMT.
Chemoresistance to PARP inhibition can be targeted in ATM-deficient PDAC.
How might it impact on clinical practice in the foreseeable future?
Triple PAD inhibition is a promising new therapeutic regimen that is warranted to undergo clinical evaluation in the treatment of ATM-mutant PDAC.
Introduction
Pancreatic ductal adenocarcinoma (PDAC) has a dismal prognosis now for several decades despite some therapeutic advances. As no efficient screening approach exists, early tumour detection is rare and prevents many patients from potentially curative surgery.1 Consequently, PDAC mortality is on the rise, whereas the mortality of other malignancies is declining.2 3 This occurs alongside with an improved understanding of PDAC biology, which has yet to be translated into a true clinical benefit.4 The intertumourous and intratumourous heterogeneity of PDAC represents a major hurdle in the effective treatment of this disease. Driver mutations such as oncogenic KRAS are not currently druggable and appear to dose-dependently initiate passenger mutations, which further fosters heterogeneity with subpopulations having distinct mutagenomes.5 Thus, new therapeutic concepts are urgently warranted to erase distinct subclones at once in a genotype-independent manner. Such an approach might be the selective interference with the DNA damage response (DDR) machinery.
Advances in omics technologies has allowed clustering based on transcriptional and genomic alterations, but the full spectrum of PDAC has yet to be fully captured.6 One particularly aggressive form of PDAC, called the unstable subtype, is supposed to be sensitive toward platinum therapy, and frequently harbours mutations in DDR genes such as BRCA1/2 and ATM (ATM serine/threonine kinase).7 Such deleterious mutations frequently occur as somatic but also as germline mutations8 although the consequences for treatment remain unclear. Therefore, targeting DDR genes and eventually rendering tumours DDR defective is an objective in molecular oncology as demonstrated by the dozens of ongoing DDR inhibitor trials, although mostly dealing with non-pancreatic cancers.9 10 For PDAC, the current standard of care regimen FOLFIRINOX (folinic acid, fluorouracil, irinotecan and oxaliplatin) appears particularly efficient in tumours harbouring DDR gene mutations.11 12 Most recently, the first tangible-targeted therapy for PDAC has been reported as maintenance therapy for germline BRCA1/2-mutated PDAC. Treatment with the PARP inhibitor olaparib in a maintenance setting resulted in a doubling of progression-free survival (PFS). However, this effect came alongside with adverse event rates limiting further dose escalation.12 In line with observed platinum sensitivity, overall survival (OS) with FOLFIRINOX on its own was the best so far reported in a clinical trial.12 However, BRCA1 or BRCA2 are not the most frequently mutated DDR genes in sporadic PDAC in a general Western population. ATM is mutated in up to 5% of sporadic PDAC13 and operates as a key enzyme in homologous recombination (HR) repair, mounting a bona fide HR-defective (HRDness)14 model for PDAC.15 Our group previously showed that ATM deficiency, even on heterozygous deletion, causes metastatic and aggressive PDAC undergoing epithelial-mesenchymal transition (EMT), negatively impacting prognosis in humans and mice.10 16 However, such aggressiveness goes alongside with an impaired DNA repair capacity causing vulnerability toward, for example, PARP inhibition.10 17 Similarly, PARP, MEK and DNA topoisomerase inhibitors showed an ATM-deficient specific efficacy in non-pancreatic cancers.18–20 Acquired PARP inhibition resistance, leading inexorably to drug failure, appears to be a common limitation on long-term treatment.21 Moreover, in the POLO trial, PARP inhibitors only prolonged PFS without any OS improvement so far. As such, a clinical need remains for more efficient combinations as PARP inhibitors together with chemotherapy cause significant toxicity.17 Thus, novel approaches are warranted to therapeutically exploit HRDness without escalating toxicity for patients. The current study identifies and dissects synergistically druggable vulnerabilities in parallel with operating signalling pathways in HR-defective PDAC modelled by ATM deficiency. Moreover, we raise a concept ascribing HRDness to any human PDAC on ATM inhibition, molecularly dissect PARP inhibition resistance and propose alternative therapeutic strategies that may be considered.
Materials and methods
CRISPR/Cas9
To generate ATM-deficient MIA PaCa-2 and PANC-1 cell lines, the pCas9_GFP plasmid and two gRNA-harbouring expression plasmids were used. The pCas9_GFP plasmid was a gift from Kiran Musunuru (Addgene plasmid #44719). The guide RNA (gRNA)-harbouring plasmids were created by inserting the specific gRNA target sequence (gRNA1: 5’-GATTTGACACTTCCCGGAAG-3’; gRNA2: 5’-CTCTGAGATGCGAGTTCGTG-3’) into an empty gRNA expression vector, that was a gift from George Church (Addgene plasmid #41824). The transfection was conducted on 200 000 cells (6-well format, Falcon) using 15 µg plasmid DNA (ie, 5 µg of each plasmid) and 7.5 µL Lipofectamine 2000 Transfection Reagent (Thermo Fisher Scientific) per reaction according to the manufacturer’s protocol. Briefly, 200 µL of plasmid-containing DMEM was mixed with 200 µL Lipofectamine-containing DMEM and incubated for 10 min at room temperature. Cells were transfected by adding the plasmid-Lipofectamine mixture. After 24 hours, the medium was refreshed by complete medium. After 3 days, GFP-positive cells were sorted by fluorescence-activated cell sorting (BD FACSAria III, BD Biosciences) and were seeded as single cells in 96-well plates. The resulting clonal cell lines were screened for ATM deletion by qualitative PCR with genomic DNA. Two independent qualitative PCR reactions were performed to amplify either an internal fragment (Int-fw, 5’-CCTCTCTACGTCCCTAGCCT-3’; Int-rev, 5’-TCCCTGTAAGTAGAGGCCCA-3’) indicating no ATM deletion, or an external fragment (Ext-fw, 5’-TCGTCAATTCAGAGGCTCGT-3’; Ext-rev, 5’-GCAAACTTTTCTGGTGGGCT-3’; oligonucleotides flanking ATM exons 2 to 4) proving the deletion of exon 2, 3 and 4 by CRISPR/Cas9 and thus, indicating ATM deletion. The presence of both amplicons in a clonal cell line indicated for a heterozygous ATM deletion (ATM+/Δ), while the presence of the external band only indicated for a homozygous ATM deletion (ATMΔ/Δ). ATM+/+ clonal cell lines (ie, only the internal fragment was amplified) were used as CRISPR/Cas9-control cell lines. ATM deletion (ATM+/Δ and ATMΔ/Δ) was further validated by sequencing (Eurofins) the external amplicon and by an alignment with the ATM gene sequence (GenBank accession number: U82828.1) resulting in a 6777 to 6791 bp spanning gap in the different ATM+/Δ or ATMΔ/Δ clonal cell lines.
Guide RNAs (score>85%) were designed using the guide design tool from https://crispr.mit.edu (Massachusetts Institute of Technology) and purchased from Synthego.
RNA interference
Lig1 knockdown was achieved by RNA interference using a lentiviral vector-based strategy. Lig1 shRNA vector (TRCN0000071153) was purchased from Sigma-Aldrich MISSION shRNA. Lentiviruses were produced as previously described.22
Cell viability assay
Cells were seeded in 96-well plates (2000 or 4000 cells per well). Cells were treated for 3 days, 24 hours after seeding. Cell viability was analysed with a MTT assay (Sigma-Aldrich) according to the manufacturer’s protocol. Absorbance was measured at 590 nm wavelength using a spectrophotometer (Tecan Infinite M200 Pro). Viability percentages were normalised to vehicle-treated cell viability. Half maximal inhibitory concentrations (IC50) were determined by GraphPad Prism software (GraphPad Software Inc). Cell viability heatmaps were generated using R software (The R Project for Statistical Computing). Yellow represents 100% cell viability and midnight blue represents 0% cell viability. Data are represented as mean of at least two independent experiments performed in at least two independent KC cell lines, two independent AKC cell lines, two independent AKPC cell lines, two independent KPC cell lines, two independent R-AKC cell lines, two independent ATM+/+ MIA PaCa-2 cell lines, two independent ATM+/Δ MIA PaCa-2 cell lines, two independent ATM+/+ PANC-1 cell lines or two independent ATM+/Δ PANC-1 cell lines.
Potential drug synergy was determined by zero-interaction potency (ZIP) analysis using SynergyFinder online software (https://synergyfinder.fimm.fi/).23
Synergy modelling
We investigated a combined-action assessment for all effective levels adopting the Loewe additivity criterion,24 where zero interaction is defined as

(dA, dB combination doses, DA, DB doses which produce the same effect when used alone). We used the median-effect equation

and obtained the parameters a and m using non-linear regression from the measurement of the single agents. The Loewe additivity zero interaction response surface25 was then calculated via solving equation

by iteration for the given dose combinations. We developed a new software to extend this approach by incorporating a third agent measured in combination at a fixed dose level. Single agent effects are fitted with the median-effect dose response curve. Two-dimensional zero interaction response surfaces with and without the third agent are then integrated into a single plot. Finally, the experimental data is overlaid, enabling a direct comparison of the two and three agent models. Also, the difference between experimental data and effects expected for zero interaction in the two and three agent models are calculated and visualised.
Detection of nascent DNA synthesis
The DNA fibre spreading assay was performed as previously described.26 Before nucleotide-labelling, cells were either pretreated with DNA-PK inhibitor CC-115 (30 nM) for 6 hour or its vehicle in the controls. Afterwards, cells were additionally either co-treated for 1 hour with ATR inhibitor VE-821 (10 nM) or its vehicle in the controls. Then, cells were labelled with CldU (20 µM 5-chloro-2-deoxyuridine, Sigma-Aldrich) for 20 min, washed twice with prewarmed PBS before labelling cells with IdU (200 µM 5-iodo-2-deoxyuridine, Sigma-Aldrich) for 20 min. The respective inhibitor treatment (ATRi, DNA-PKi or ATRi+DNA PKi) was kept throughout the whole experiment. Additionally, during IdU labelling, cells were either co-treated with PARP inhibitor olaparib (300 nM) or its vehicle in the controls. Subsequently, cells were washed, harvested and resuspended in ice cold PBS. Two thousand and five hundred cells were transferred onto a slide, lysed with 6 µL of 0.5% SDS, 200 mM Tris-HCl, pH 7.4, 50 mM EDTA and incubated at room temperature for 6 min. Slides were tilted approximately 30° to allow DNA to spread via gravity, air dried for 7 min, fixed for 5 min with 3:1 methanol:acetic acid, air dried for 7 min and stored in 70% ethanol at 4°C overnight. Afterwards, slides were processed for denaturation/deproteination in 2.5 N HCl for 1 hour, followed by immunofluorescence staining. DNA fibres were imaged and DNA fibre track lengths measured with a Keyence BZ-9000 Analyzer.
The replication elongation rate was measured for ongoing forks (bi-coloured, CldU-IdU) by track length analysis (>800 fibres each). For reasons of clarity, only IdU-track lengths are shown. To evaluate replication fork stalling, the fork asymmetry was determined. Therefore, the ratio of the longer versus the shorter track was calculated. An increase of the ratio of either CldU/IdU or IdU/CldU indicates stalling as the difference in the track length might be due to stalling in the shorter track.27
For a detailed description of further materials and methods, see online supplementary methods, including primer sequences (online supplementary table 2) and antibodies used in the study (online supplementary table 3).
Supplemental material
Supplemental material
Results
ATM mutations in human PDAC
First, we assessed in cBioPortal the available genomic data sets for somatic DDR gene mutations in human sporadic PDAC. Indeed, 60 (8.9%) out of 670 samples had at least one mutation in DDR genes (from a panel of eight DDR genes7). The most frequently mutated gene was ATM with 38.3% of all DDR mutations (23/60) and an overall mutation rate of 3.4% (23/670) (figure 1A). In comparison, BRCA2 and BRCA1 mutations are respectively ranked second and fourth (1.5% and 1.0%; figure 1A), making ATM-mutated PDAC a relevant subtype to target. The analysis of pancreatic cancer mutations from a PanCancer study also confirmed ATM as the most commonly mutated DDR gene (among an enlarged panel of 25 DDR genes; online supplementary figure S1A). We also revisited a set of studies investigating PDAC germline mutations and again found ATM as the most frequently mutated gene of the DDR group (24/1,441; online supplementary table 1).8 28 29 Twenty-seven different ATM mutations are described in the PDAC database. Most of them are truncating mutations localised toward the N-terminus, while missense mutations mostly cluster within the functional domains (FAT, PI3K and FATC) (online supplementary figure S1B,C). In addition, ATM is the most frequently mutated DDR gene across eight different cancer types, with rates of more than 5%, thus rendering any genotype specific intervention highly relevant30 (online supplementary figure S1D).

Customised screening identifies synergistically operating targets in ATM-deficient PDAC. (A) Frequency of DNA repair gene alterations (n=60) in primary pancreatic ductal adenocarcinomas (PDAC) (n=670) from three PDAC sequencing data sets using cBioPortal. Of note, no MLH1 alteration was found. (B) Mini drug viability assay screening performed on Atm+/+; LSL-KrasG12D/+; Ptf1aCre/+ (KC) and Atmfl/fl; LSL-KrasG12D/+; Ptf1aCre/+ (AKC) cells with increasing doses of 45 drugs. (C) Contingency table comparing drug target and AKC-specific effect. Schematic representations of (D) drug synergism, (E) synergistic treatment and (F) drug synergism using zero interaction potency (ZIP) model. (G), (J), (M) and (P), Schematic representation of viability assays and colony formation assays respectively shown in (H–I), (K–L), (N–O) and Q–R). (H), (K), (N) and (Q), viability assay and (I), (L), (O) and (R), colony formation assay on KC and AKC cells treated with varying combinations of olaparib (PARPi), VE-822 (ATRi) and CC-115 (DNA-PKi). White solid lines delimit the area with a cell viability below 70% (H), (K), (N) and (Q). Drug synergism analysis of the viability assay shown in (Q) using (S) a three-agent model comparing zero-interaction surfaces with and without PARPi fixed at 1 µM and (T) MuSyC (multidimensional synergy of combinations) model separating potency (α; synergistic effect when α>0, antagonistic effect when α<0) from efficacy (β; synergistic effect when β>0, antagonistic effect when β<0). 5FU, 5-fluorouracil; AZD, AZD7762; CARB, carboplatin; CIS, cisplatin; DABR, dabrafenib; DECI, decitabine; DORS, dorsomorphin; DOXO, doxorubicin; DSB, double-strand break; ERLO, erlotinib; ETO, etoposide; EVER, everolimus; GEM, gemcitabine; IRI, irinotecan; JAK, JAK inhibitor I; LAPA, lapatinib; METF, metformin; MIR, mirin; MITO, mitomycin C; MK, MK-1775; MLN, MLN4924; NAC, N-acetylcystein; NIRA, niraparib; NU, NU7026; OLA, olaparib; OXA, oxaliplatin; PACL, paclitaxel; PALB, palbociclib; PD, PD0325901; PD1, PD-1/PD-L1 inhibitor 1; PEME, pemetrexed; SB, SB431542; SELU, selumetinib; SORA, sorafenib; SUNI, sunitinib; TIV, tivantinib; TRAM, trametinib; Veh, vehicle; VENE, venetoclax; VINO, vinorelbine; VORI, vorinostat; WORT, wortmannin.
Customised screening to identify ATM-deficient vulnerabilities
To assess genotype-specific vulnerabilities for determination of (i) the optimal conventional chemotherapeutic induction regimen and (ii) the best targeted therapy, a systematic drug screen was performed on several ATM-deficient (Atmfl/fl; LSL-KrasG12D/+; Ptf1aCre/+, AKC) versus ATM-proficient (Atm+/+; LSL-KrasG12D/+; Ptf1aCre/+, KC) primary murine PDAC cells.10 16 Out of 45 clinically approved chemotherapeutic agents or small molecule inhibitors, most were either ineffective or operated in a non-genotype specific manner. However, several drugs showed higher activity in ATM-deficient cells (figure 1B). A subset was validated on systematic determination of IC50 concentrations and clonogenic colony formation assays. Currently, the combination therapy regimens (i) nab-paclitaxel plus gemcitabine and (ii) FOLFIRINOX represent the standard of care for treating metastatic PDAC patients.31 Interestingly, neither platinum agents and fluorouracil (5-FU) nor gemcitabine and paclitaxel operated in a genotype-specific manner (figure 1B; online supplementary figure S2A-F; data not shown10). Intriguingly, the screen and validation experiments suggested that ATM-deficient PDAC can be preferentially targeted by the DNA topoisomerase inhibitors irinotecan (TOP1 inhibitor) and etoposide (TOP2 inhibitor) in vitro and in vivo, the latter implemented in subcutaneous experiments in nude mice as well as in CAM (chorioallantoic membrane) assays (online supplementary figure S3A-I), as previously reported in lymphomas.32 Similarly, within the targeted therapies used, a limited set of signalling inhibitors showed higher cytotoxicity in AKC cells (online supplementary figure S2G-L). MEK inhibition appeared to be a target based on the clonogenicity assay results in AKC cells (online supplementary figure S2H) pointing toward data reported for lung cancer.20 However, its selective targeting ability was not be confirmed by IC50 determination (online supplementary figure S2G). Notably, agents potentially increasing DNA damage operated significantly more in AKC than KC cells, supporting our previous findings showing that ATR and PARP inhibition are synthetically lethal with ATM-deficiency7 33 (figure 1C). These data suggest that drugs interfering with the DDR machinery such as PARP inhibitors are most effective in the setting of a mutant ATM gene to expect a treatment response.
Synergistic interference with the DNA repair machinery to exclusively target unstable PDAC
The success of treatments based on single DDR inhibition may be limited by resistance due to compensatory pathways, drug toxicity and lack of reliable response predictors.21 Exploiting vulnerabilities by (i) seeking a synthetically lethal interaction within a given PDAC genotype and/or by (ii) synergistic interaction between applied drugs could boost both efficacy and tolerability (figure 1D). Various inhibitors or inhibition regimens are referred with an “i” at the end of the targeted molecule, for example, PARPi. In order to identify drug synergism, we used SynergyFinder, which is based on a zero-interaction potency (ZIP) model (figure 1D–F). Within the tested drugs from our customised screen, we observed no AKC-specific synergism between PARPi and CHEK1/CHEK2i, PARPi and MEKi, PARPi and TOP1i and PARPi and TOP2i (online supplementary figure S4A-H). In contrast, high synergism at low doses specifically in AKC could be observed on combined inhibition of PARP (olaparib, PARPi) and ATR (VE-822, ATRi) (figure 1G–I; online supplementary figure S4I). Addition of the ATR inhibitor (ATRi) allows up to five times further dose reduction of PARPi in AKC cells (figure 1H). A similar synergistic interaction was found on combined PARPi and DNA-PKcs inhibition (referred as DNA-PKi) (figure 1J–L; online supplementary figure S4J). The combined treatment of PARPi and DNA-PKi allowed a significant dose reduction by 5 to 10 times of each agent compared with a single drug treatment (figure 1K). In a comparable manner, a synergistic effect was also obtained when combining ATRi and DNA-PKi (figure 1M–O; online supplementary figure S4K). To take maximum advantage of drug synergism to further reduce the concentration of individual drugs, we titrated ATRi and DNA-PKi against a sublethal dose of the PARPi olaparib. To reach the same level of cytotoxic effect (>70%), a significant dose reduction was possible with 100-fold and fivefold dose reduction of ATRi and DNA-PKi, respectively, when a sublethal PARPi dose was added (figure 1P–R). To extend this analysis to a three-agent model, we developed a new therapy algorithm incorporating a third agent measured in combination at a fixed dose level (PARPi, 1 µM). We observed a substantial deviation (up to −0.15) from the zero-interaction response surface on PARPi, indicating an optimal synergistic effect in the lower dose range of the three drugs exclusively when ATM is deleted (figure 1S). To corroborate these findings, we performed an additional multidimensional synergy analysis using MuSyC, a software tool that separately assesses synergistic potency and efficiency.34 While ATRi and DNA-PKi exhibit a synergistic efficacy (β>0) and a synergistic potency (α>0) only in AKC cells, the highest synergistic efficacy was observed after the addition of PARPi in AKC cells, at the cost of a decreased but still synergistic potency (figure 1T). An optimised dosage of each drug (PARPi, ATRi and DNA-PKi) was then tested in clonogenicity assays, further corroborating each synergistic combination (figure 1I, L, O and R). These data suggest that ATM-deficient pancreatic cancer relies on both DNA-PKcs and ATR in the setting of PARPi to preserve DNA homoeostasis.10 35 This low-dose triple therapy of simultaneous PARPi, ATRi and DNA-PKi will be referred as PAD.
To determine if the PAD regimen would be effective in the in vivo setting, KC and AKC s.c. allografts were established in vivo and the effect of PAD treatment was compared (figure 2A). In contrast to KC allografts, AKC tumour growth was significantly blocked on PAD treatment, leading to smaller tumours at time when the deterioration of untreated mice led to experiment termination (figure 2B and C). Concomitantly, there was marked induction of DNA damage (H2AX p-S319) and apoptosis in AKC tumours on PAD treatment compared with KC counterparts (figure 2D–F).
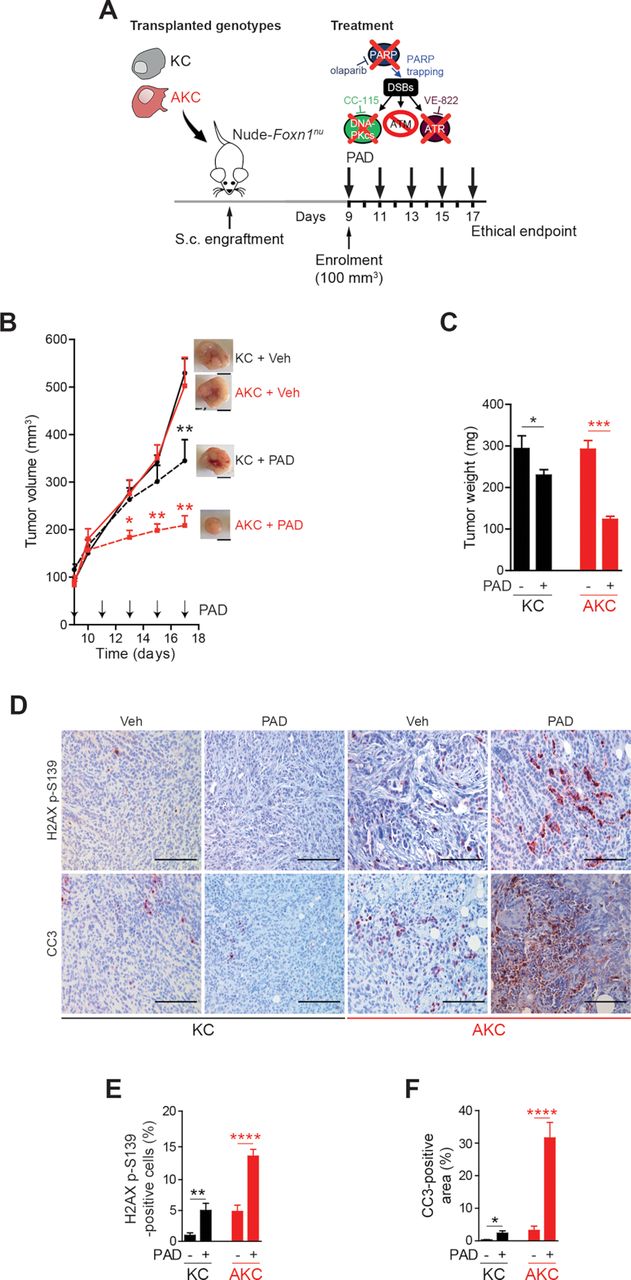
ATM-deficient tumour growth control on PAD treatment. (A) Schematic representation of the subcutaneous assay shown in (B) with treatment administration schedule.(B) Time-dependent development (over the course of 17 days) of subcutaneously engrafted tumours arising either from Atm+/+; LSL-KrasG12D/+; Ptf1aCre/+ (KC) and Atmfl/fl; LSL-KrasG12D/+; Ptf1aCre/+ (AKC) cells (respectively, black circle and red square) treated or not (respectively, dashed lines and solid lines) with a combination of olaparib (50 mg/kg), VE-822 (20 mg/kg) and, CC-115 (2.5 mg/kg) (PAD, PARPi/ATRi/DNA-PKi), with representative macroscopic images. Scale bars represent 5 mm. (C) Quantification of tumour weight of resected tumours from subcutaneous assay shown in (B). (D) Immunohistochemistry staining for H2AX p-S139 and cleaved caspase-3 (CC3) and (E) quantifications of H2AX p-S139-positive cells and (F) of CC3-positive surface in resected tumours from subcutaneous assay shown in (B). Scale bars represent 100 µm. Veh, vehicle. *, p<0.05; **, p<0.01; ***, p<0.001; ****, p<0.0001.
PAD triggers DNA damage and aneuploidy in ATM-deficient PDAC cells
We next examined in vitro the molecular mechanism by which PAD resulted in more effective tumour inhibition in AKC versus KC tumours. Indeed, the amount of double-strand breaks (DSBs) as determined by the amount of H2AX p-S139-positive cells in flow cytometry remained unchanged in KC cells, while AKC cells showed a 2.1-fold (respectively, 71.5% vs 34.4%; p=0.0093) increase on PAD treatment (figure 3A and B). DSBs accumulated predominately with PARPi and DNA-PKi treatment, but not after ATRi, and showed the highest synergistic boost with PAD triple inhibition (online supplementary figure S5A,B). To test whether ATM deficiency generates an HR-deficiency phenotype, we investigated the key HR repair factor RAD51. In non-treatment conditions, AKC cells displayed significantly fewer RAD51-positive foci than KC cells (figure 3C and D). In contrast, after PAD treatment, AKC cells displayed comparable numbers of RAD51 foci to KC cells (figure 3C and D), but an increase of H2AX p-S139 levels (figure 3A and B), suggesting that ATM deficiency may exert a selective effect on the ability to form RAD51 nucleoprotein filaments at DSB sites. Similar results were obtained when evaluating nuclear RAD51 foci in CCNA-positive cells (surrogate marker of S/G2-phase cells; data not shown), which excludes a simple cell cycle change. In order to determine DNA repair capacity via alternative DNA repair pathways in HR-deficient AKC cells compared with KC cells, we measured DSB repair frequency by total non-homologous end joining (NHEJ) or single-strand annealing (SSA) (figure 3E). While the measurement of total NHEJ capacity showed no significant difference between genotypes, ATM deficiency clearly causes a de-repression of inaccurate SSA pathway (figure 3E). In summary, we demonstrate that ATM deletion in PDAC indeed ascribes HRDness leading to DNA damage accumulation on genotoxic treatment.

HR-deficient ATM-deleted PDAC cells accumulate DNA damage and mitosis defects on PAD treatment. (A) Representative flow cytometry analysis of H2AX p-S139-positive Atm+/+; LSL-KrasG12D/+; Ptf1aCre/+ (KC) and Atmfl/fl; LSL-KrasG12D/+; Ptf1aCre/+ (AKC) cells treated or not with olaparib (PARPi, 1 µM), VE-822 (ATRi, 20 nM) and CC-115 (DNA-PKi, 30 nM) in combination for 48 hours (PAD, PARPi/ATRi/DNA-PKi), and (B) graphic representation showing results of flow cytometry analyses of H2AX p-S139-positive KC and AKC cells treated or not as in (A). (C) Immunofluorescence staining for RAD51 (red) and (D) quantification of RAD51 foci in KC and AKC cells treated or not with olaparib, VE-822 and, CC-115 in combination (PAD) for 48 hours (as in A). Cells were counterstained with DAPI (blue). Scale bars represent 10 µm.(E) Analysis of double-strand break (DSB) repair pathway usage in KC and AKC cells transfected with DSB repair substrates for total non-homologous end joining (tNHEJ) or single-strand annealing (SSA) plus with ISceI-endonuclease expression plasmid for cleavage of the substrates followed by cultivation for 24 hours, and treated as in (A). DSB repair frequencies are shown as percentage of transfected and living cells. (F) Direct fluorescence staining of DNA by DAPI (white) and quantification of (G) anaphase bridges in KC and AKC cells treated or not with olaparib, VE-822 and CC-115 as single agents or in combination for 48 hours (as in A). White arrows show laggards (Lag) and anaphase bridges (Bri) (F). Scale bars represent 10 µm. (H) Direct fluorescence staining of DNA by DAPI (white on upper panels and blue on lower panels) and of cortical actin by phalloidin-Atto565 (red on lower panels) and (I) quantification of multinucleated cells in KC and AKC cells treated or not with olaparib, VE-822 and CC-115 as single agents or in combination for 48 hours (as in A). White arrows show multinucleated cells (Mu). Scale bars represent 10 µm. (J) Direct fluorescence staining of DNA by DAPI (white on upper panels and blue on lower panels) and of cortical actin by phalloidin-Atto565 (red on lower panels) in KC and AKC cells treated or not with olaparib, VE-822 and CC-115 as single agents or in combination for 48 hours (as in A) showing typical mitotic catastrophe event. Scale bars represent 10 µm. SSC, sidewards scatter. *, p<0.05; **, p<0.01; ***, p<0.001; ****, p<0.0001.
Accordingly, metaphase spreads indicated more structural aberrations such as chromatid fusions in PAD-treated AKC than in KC cells (online supplementary figure S5C-E). At low dosage treatment, these aberrations appeared to be induced by PARPi and synergistically by ATRi plus DNA-PKi in AKC cells. Unresolved DNA lesions such as DSBs and replication intermediates can be transmitted into mitosis to subsequently create defects in chromosome segregation and then, trigger apoptosis after transmission to the next mitosis.36 Indeed, PAD treatment led to a dramatic increase of mitotic aberrations such as lagging chromosomes and anaphase defects (figure 3F and G). Consistently, AKC cells exhibited significant increase of micronuclei and multinucleated cells on PAD treatment compared with KC cells (figure 3H; online supplementary figure S5F,G). Micro-nucleation and multi-nucleation are morphological signs of mitotic catastrophe, a process responding to aberrant mitosis by leading to an irreversible process of cell death that can be driven by replication stress.37 Indeed, cells exhibiting nucleic alterations considered as mitotic catastrophe events (eg, >2 micronuclei or lobes38) were observed only in PAD-treated AKC cells (figure 3J).
DNA replication dynamics and its molecular consequences upon PAD treatment
Oncogene-induced replication stress has been recognised as a potential Achilles’ heel of cancer cells.39 For in depth analysis of PAD treatment effects, we analysed DNA replication dynamics in KC and AKC cells using DNA fibre assays (figure 4A). ATM deficiency in PDAC cells accelerated DNA replication (figure 4B), as previously reported by our group.10 On calculation of the longer/shorter track ratios as a measure of fork asymmetries, we detected ratios >1 in KC cells, most likely reflecting oncogene-induced replication stress.27 AKC cells also showed track ratios >1, but reduced values when compared with KC cells (figure 4C). We then analysed DNA replication fibres after inhibitor intervention. Single and combined DNA-PKi and ATRi caused a marked shortening of DNA replication tracks independently of the ATM status (figure 4B). Irrespective of the severe ATRi-induced replication phenotype, the effect of fork slowing remained detectable in KC versus AKC cells, indicating different modes of action by ATM and ATR on fork speed. Conversely, the ATM-dependent effect was no longer seen in the presence of DNA-PKi, suggesting an epistatic relationship of ATM with DNA-PKcs. Both DNA-PKi and ATRi treatment exacerbated fork asymmetries in AKC cells (figure 4C), perhaps due to a general increase in genomic damage generating obstacles for fork movement. Exacerbation of DNA replication stress by additional treatment with PARPi triggered almost no alteration of DNA replication dynamics. Notably, however, treatment with PARPi neutralised the effect of ATM deficiency on DNA replication speed in ATRi- and DNA-PKi-treated cells (figure 4B). Olaparib can cause PARP trapping on chromatin and replication fork collapse, which may interfere with DNA replication particularly on excessive origin firing due to ATRi.40 41 Indeed, PAD treatment caused the most pronounced PARP trapping (figure 4D). Interestingly, any combination of the three drugs similarly increased PARP binding to DNA, while DNA-PKi alone also had a strong impact in AKC cells. As expected, PARP binding was less pronounced in KC cells (figure 4D). Finally, we assessed the molecular consequences of PAD treatment on P53 signalling. AKC cells showed an increase of phosphorylation at serine 18 (P53 p-S18) and stabilisation of P53 with both PARPi and PAD treatment. This suggests that P53 is still activated by residual ATR and DNA-PKcs activities as part of the DDR, following genotoxic stress or independently of these by PI3K-related kinases32 (figure 4E and F). We also observed that the canonical P53 target genes Mdm2 and p21Cip1 as well as pro-apoptotic P53 target genes (ie, Bax, Bak1 and Noxa) were significantly upregulated in PAD-treated AKC versus KC cells, along with P53 target genes such as Trp53inp1,42 which in turn can phosphorylate P53 in an ATM/ATR/DNA-PKcs-independent manner43 (figure 4F). To address if P53 is pivotal to mediate the cytotoxic effect of PAD, we generated pancreatic cancer cell lines from AKC mice with inactivation of Trp53 in AKC mice (Atmfl/fl; Trp53fl/fl; LSL-KrasG12D/+; Ptf1aCre/+, termed “AKPC” tumour-bearing mice (mouse strain part of distinct study)) and isolated respective pancreatic tumour cell lines (figure 4G and H). Indeed, AKPC cells showed an attenuated cell death response (figure 4I) when compared with P53-proficient AKC counterparts, demonstrating that P53 participates the PAD-induced apoptosis (figure 4E, F and J). However, a relevant proportion of ATM-deleted cells appears to also execute a P53-independent cell death route as suggested by the presence of micro-nucleated and multi-nucleated cells indicative for mitotic catastrophe after aberrant mitoses induced by PAD genotoxic stress (figure 3F–J; online supplementary figure S5F-G), suggesting that P53 operates as a critical but not the sole checkpoint in mediating therapy-induced cell death on DDR inhibition in ATM-deficient PDAC (figure 4J).
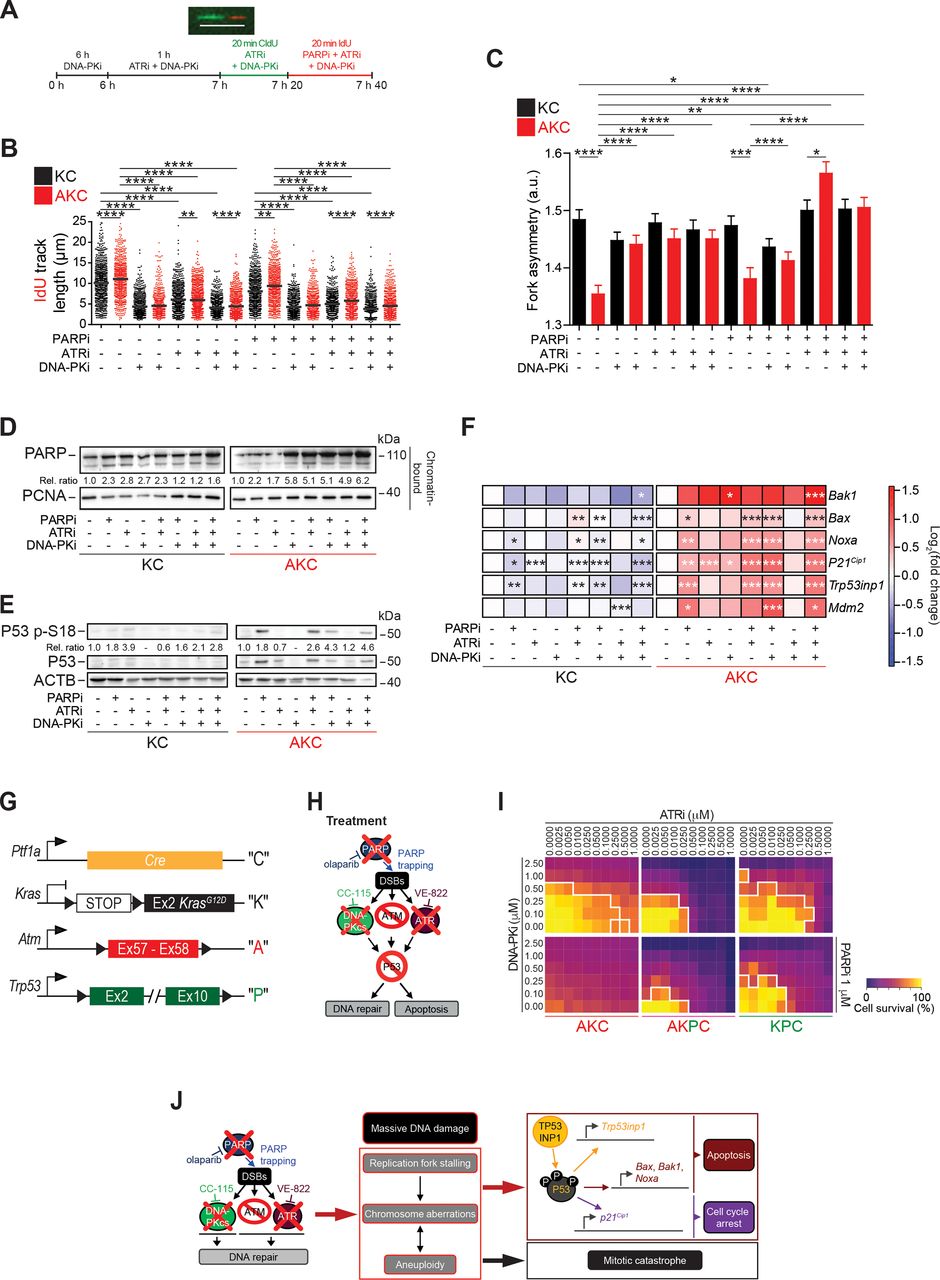
DNA replication dynamics and its molecular consequences on PAD treatment. (A) Schematic technical overview of DNA fibre spreading assay and a representative fibre image. Scale bar represents 10 µm. Evaluation of (B) IdU track length and (C) fork asymmetry from DNA fibre spreading assay performed on Atm+/+; LSL-KrasG12D/+; Ptf1aCre/+ (KC) and Atmfl/fl; LSL-KrasG12D/+; Ptf1aCre/+ (AKC) cells treated or not with olaparib, VE-821, CC-115, or a combination of them as shown in (A). Mean values were calculated by measuring the IdU-track emanating from a CldU-track (ongoing fork, >800 fibres each). (D) Western blot analysis of PARP trapping on chromatin-bound fractions and of (E) P53 p-S18 on whole cell lysates of KC and AKC cells treated or not with olaparib (PARPi, 1 µM), VE-822 (ATRi, 20 nM) and CC-115 (DNA-PKi, 30 nM) in combination for 72 hours (PAD, PARPi/ATRi/DNA-PKi). (F) qRT-PCR analysis of pro-apoptotic- and cell cycle arrest-P53 target genes and Mdm2 expression in KC and AKC cells treated or not with olaparib, VE-822 and CC-115 as single agents or in combination for 72 hours (as in D and E). (G) Schematic representation of Ptf1aCre (“C”), LSL-KrasG12D (“K”), floxed Atm (‘A’), and floxed Trp53 (“P”) alleles. (H) Schematic representation of viability assays shown in (I). (I) Viability assay on AKC, Atmfl/fl; Trp53fl/fl; LSL-KrasG12D/+; Ptf1aCre/+ (AKPC), and Atm+/+; Trp53fl/fl; LSL-KrasG12D/+; Ptf1aCre/+ (KPC) cells treated with varying combinations of olaparib (PARPi), VE-822 (ATRi) and CC-115 (DNA-PKi). White solid lines delimit the area with a cell viability below 70%. (J) Schematic representation of mechanistic effects of PAD tritherapy on AKC cells. CldU, 5-chloro-2'-deoxyuridine; Ex, exon; DSB, double-strand break; IdU, 5-iodo-2'-deoxyuridine. *, p<0.05; **, p<0.01; ***, p<0.001; ****, p<0.0001.
Genetic and chemical ATM inactivation leverages HRDness in human PDAC
To determine if our finding were relevant human PDAC, either one or both ATM alleles were deleted in the MIA PaCa-2 and PANC-1 pancreatic cancer cell lines using CRISPR/Cas9 approach (online supplementary figure S6A-D). Deletion of ATM sensitised toward PARPi in these human PDAC cell lines (figure 5A; online supplementary figure S6E). Using the ZIP model, we confirmed the synergistic effects on ATRi and DNA-PKi in ATM heterozygote (ATM+/Δ) PDAC cells, although higher olaparib doses were required compared with murine counterparts (figure 5B and C; online supplementary figure S6F). PAD treatment of human PDAC s.c. xenografts resulted in a marked inhibition of tumour growth accompanied by selective induction of H2AX p-S139 phosphorylation and cell death in ATM+/Δ tumours (figure 5D–G). Conversely, monoallelic as well as biallelic truncation of somatic ATM also sensitised human PDAC cell lines to both single PARPi and PAD treatment (figure 5A–G; online supplementary figure S6E,F,H).

Genetic and chemical ATM inactivation leverages HRDness in human PDAC. (A) Viability assay analysis of olaparib treatment in ATM+/+, ATM+/Δ and ATMΔ/Δ MIA PaCa-2 cells. (B) Schematic representation of viability assay shown in (C). (D) Schematic representation of the subcutaneous assay shown in (E) with treatment administration schedule. (E) Time-dependent development (over the course of 24 days) of subcutaneously engrafted tumours arising from ATM+/Δ MIA PaCa-2 cells treated (dotted line) or not (solid line) with a combination of olaparib (50 mg/kg), VE-822 (20 mg/kg) and, CC-115 (2.5 mg/kg) (PAD, PARPi/ATRi/DNA-PKi). (F) Immunohistochemistry staining for H2AX p-S139 and (G) quantifications of H2AX p-S139-positive cells in resected tumours from subcutaneous assay shown in (E). Scale bars represent 100 µm. (H) Viability assay analysis of olaparib treatment in ATM+/+ MIA PaCa-2 cells treated or not with an ATM inhibitor (AZD0156). (I) Schematic representation of viability assay shown in (J). (J) Viability assay on ATM+/+ MIA PaCa-2 cells treated or not with an ATM inhibitor (AZD0156 or KU-60019) and with varying combinations of olaparib (PARPi), VE-822 (ATRi), and CC-115 (DNA-PKi). White solid lines delimit the area with a cell viability below 70%. (K) Schematic representation of the subcutaneous assay shown in (L) with treatment administration schedule. (L) Time-dependent development (over the course of 25 days) of subcutaneously engrafted tumours arising from ATM+/+ MIA PaCa-2 cells treated or not with PAD as in (E) (respectively, grey and black squares) and/or an ATM inhibitor (2.25 mg/kg AZD0156; respectively, purple and blue triangles). (M) Quantification of tumour weight of resected tumours from subcutaneous assay shown in (L). (N) Immunohistochemistry staining for H2AX p-S139 and O), quantification of H2AX p-S139-positive cells in resected tumours from subcutaneous assay shown in (L). Scale bars represent 100 µm. (P) Body weight progression (over the course of 25 days) of athymic Nude-Foxn1nu mice enrolled in the subcutaneous assay shown in (L). The horizontal red dashed line represents the weight loss ethical endpoint (−20%). Veh, vehicle. **, p<0.01; ***, p<0.001; ****, p<0.0001; a and b, p<0.0001 when compared with ATM+/+ MIA PaCa-2 cells, §, p<0.05 when compared with ATM+/Δ MIA PaCa-2 cells (A).
Based on our findings, we wondered if ATM inhibition might be effective in rendering wild-type PDAC cells sensitive to PAD treatment and thereby, extend the target population of PDAC who might be candidates for this therapeutic approach. To test this hypothesis, we used two clinical grade ATM inhibitors (ATMi) and combined them with either PARPi alone or with PAD and examined therapeutic responses in ATM wild-type PDAC cells (figure 5H–J; online supplementary figure S6G-H). ATM inhibition (ATMi) plus PAD treatment was more effective than PAD alone in the context of monoallelic ATM deletion, and more effective than ATMi which showed no efficacy as a single therapy. This regimen was quite effective when tested in vivo, resulted in frank tumour regression compared with PAD or ATMi alone in this model (figure 5K–M). Histological analysis of treated tumours revealed massive DSBs accumulation on four-drug treatment (figure 5N and O). Of note, ATMi itself already significantly increased the baseline level of H2AX p-S139-positive signals in ATM-proficient MIA PaCa-2 cells (figure 5N and O). The toxicity of PAD was evaluated by monitoring weight loss in mice during treatment. At least in some Nude-Foxn1nu mice, the adverse effect reached the limit of 20% (defined as the ethical endpoint) pointing to the potential for relevant toxicity with this regimen despite its marked efficacy (figure 5P).
Induced HRDness in relevant preclinical model systems
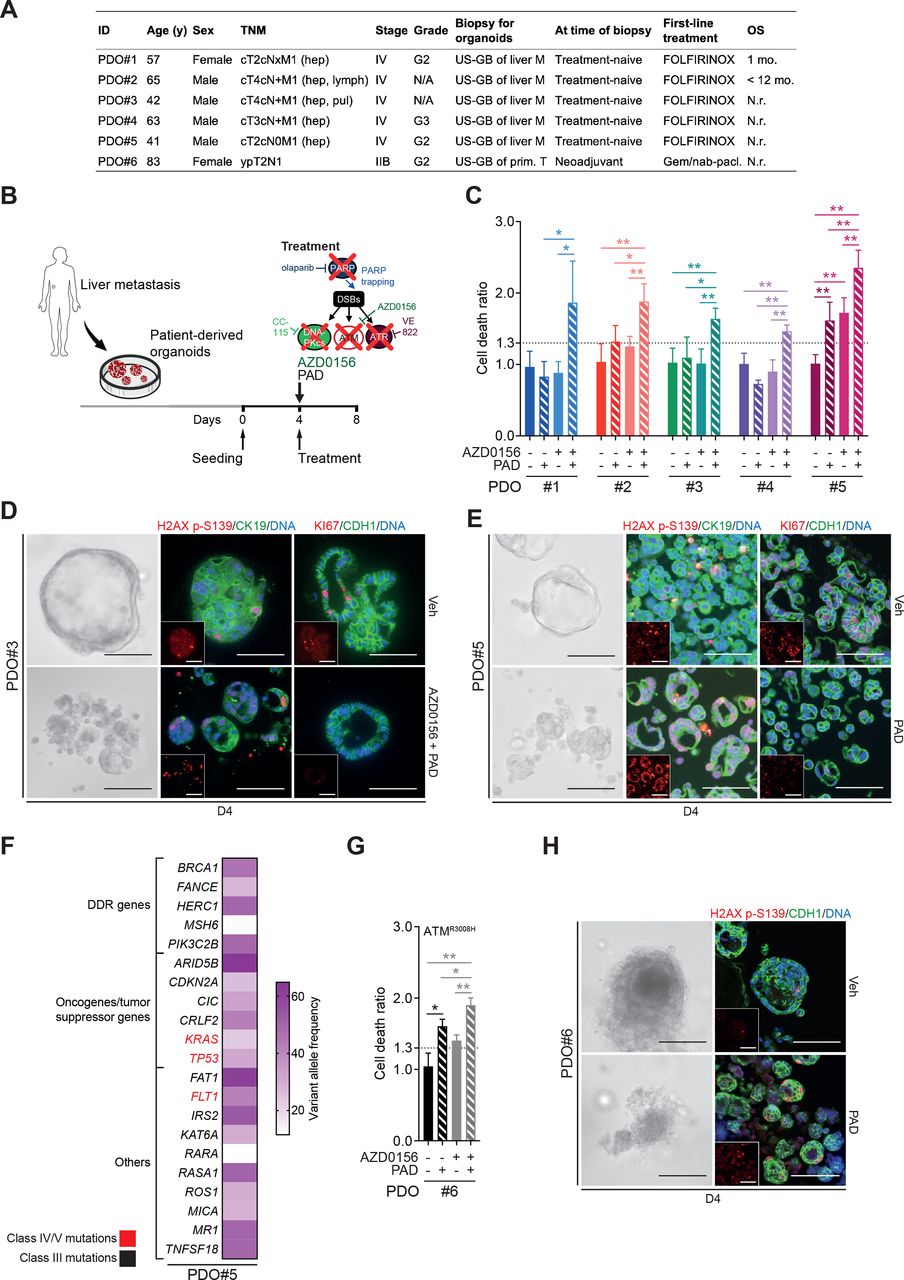
To provide evidence from more clinically relevant human model systems, ATMi plus PAD regimen was validated in a set of 5 patient-derived organoids (PDOs) randomly selected from a library of 22 PDOs isolated from liver metastasis biopsies. The patients from which the PDOs were derived were all treatment-naïve with a stage IV PDAC and were examined regardless of their ATM status. They subsequently received FOLFIRINOX treatment per clinical performance (figure 6A). ATM inhibition sensitised all PDOs to PAD as revealed by increased cell death ratio (CDR44; figure 6B–C) and increased DNA damage (H2AX p-S139), but a lower proliferation (KI67) (figure 6D). Interestingly, PDO#5 was the only sample that responded to PAD treatment in the absence of ATM inhibition (figure 6C and E), although adding the latter still significantly increased cell death rate (figure 6C). Panel sequencing of this particular organoid line revealed numerous class III mutations (unclear significance) in DDR genes (eg, BRCA1, MSH6, FANCE) as well as class IV/V mutations in KRAS, FLT1 and TP53 (figure 6F). Defective HR is associated with small indels and genome rearrangements but can also present with base substitution patterns.45 46 Those patterns can be captured using Mutalisk (MUTation AnaLysIS toolKit) analysis. Indeed, PDO#5 displayed a cosine similarity score of 0.391 for a DDR signature. To support the hypothesis that PAD treatment is an effective treatment strategy for DDR defective PDAC, we used a PDO cell line isolated from an ATM-mutated PDAC (ATM p.R3008H; categorised as class IV). As predicted, PAD alone led to substantial cell death (figure 6G and H), which was further increased by ATM inhibition (ATMi) (figure 6G), suggesting residual activity of the ATMR3008H protein. Immunofluorescence analysis for H2AX p-S139 levels demonstrated significant accumulation of DNA damage following treatment (figure 6H). Organoids isolated from patient-derived xenograft pieces overall confirmed efficiency of PAD plus ATMi regimen (online supplementary figure 7A-C).

ATM inhibition or mutation sensitises PDAC patient-derived organoids to PAD therapy. (A) Clinical characteristics of biopsied PDAC patients. (B) Schematic representation of cytotoxicity assay shown in (C). (C) Cytotoxicity assay on patient-derived organoids (PDOs) treated or not with an ATM inhibitor (AZD0156, 10 µM) and with olaparib (PARPi, 2 µM), VE-822 (ATRi, 40 nM) and CC-115 (DNA-PKi, 60 nM) in combination for 96 hours (PAD, PARPi/ATRi/DNA-PKi). PDO is considered to be sensitive when cell death ratio >1.3. (D) Representative images and immunofluorescence staining for H2AX p-S139 (red) and CK19 (green) and for KI67 (red) and CDH1 (green) on PDO#3 treated or not with AZD0156 and PAD in combination for 96 hours as in (C). Inlets exclusively show respective red channel. Scale bars represent 200 µm. Cells were counterstained with DAPI (blue). (E) Representative images and immunofluorescence staining for H2AX p-S139 (red) and CK19 (green) and for KI67 (red) and CDH1 (green) on PDO#5 treated or not with PAD in combination for 96 hours as in (C). Inlets exclusively show respective red channel. Scale bars represent 200 µm. Cells were counterstained with DAPI (blue). (F) Spectrum of mutated genes identified in PDO#5 and mutational burden per gene evaluated by panel-sequencing. (G) Cytotoxicity assay on ATMR3008H PDOs treated or not with AZD0156 and with PAD in combination for 96 hours as in (C). (H) Representative images and immunofluorescence staining for H2AX p-S139 (red) and CDH1 (green) on ATMR3008H PDOs treated or not with PAD in combination for 96 hours as in (C). Inlets exclusively show respective red channel. Scale bars represent 200 µm. Cells were counterstained with DAPI (blue). DDR, DNA damage repair; DSB, double-strand break; FOLFIRINOX, folinic acid-fluorouracil-irinotecan-oxaliplatin; Gem./nab-pacl., gemcitabine/nab-paclitaxel; hep, hepatic; lymph, lymph node; pul, pulmonary; M, metastasis; N.r., not reached; OS, overall survival; Prim. T, primary tumour; TNM, tumour, nodes, metastasis classification; US-GB, ultrasound-guided biopsy; Veh, vehicle. *, p<0.05; **, p<0.01.
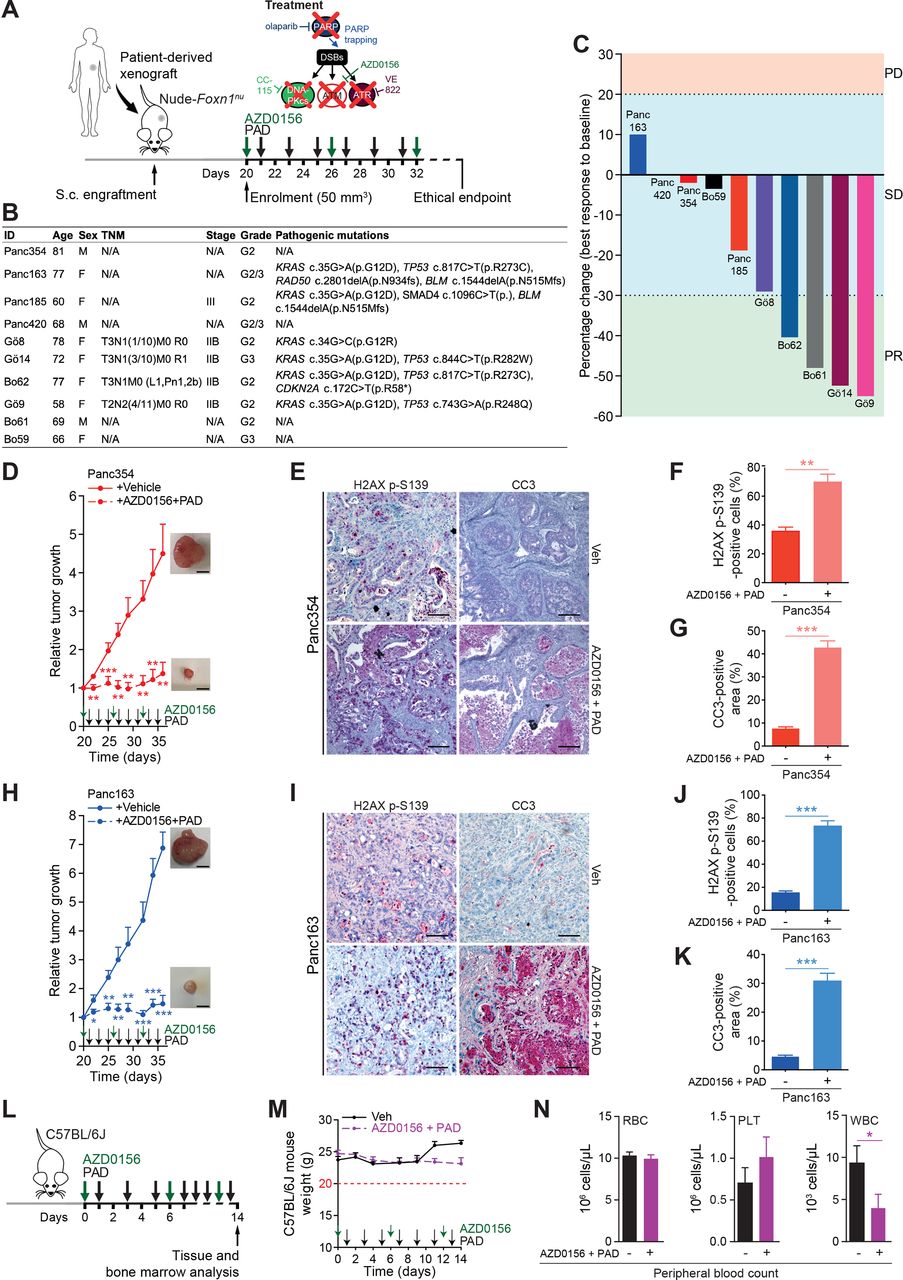
Finally, we tested the in vivo responsiveness of PAD plus ATMi in a set of 10 patient-derived PDAC xenografts (PDXs) (figure 7A and B). Evaluation of tumour response according to clinical standards for patients revealed stable disease in 6 out of 10 PDX and partial response in 4 out of 10 PDX, with none of them passing the progressive disease threshold according to RECIST criteria (figure 7C). Conversely, ATMi plus PAD led to full tumour control or even tumour shrinkage over a prolonged period of time (figure 7D and H; online supplementary figure S8). Concomitantly, immunostainings revealed high level of DSBs and increased apoptosis in treated tumours when compared with vehicle-treated controls (figure 7E–G and I–K). In light of the adverse events caused in the Nude-Foxn1nu mice (figure 5P), we further probed toxicity profiles of the ATMi plus PAD regimen in immunocompetent C57BL/6J mice. Intriguingly, 2 weeks of treatment neither led to significant weight loss nor to other ethical study endpoints (eg, prostration, breathing difficulty, lack of vigilance) in treated mice (figure 7L and M). Accordingly, peripheral blood (PB) tests displayed only slight leucopenia but no evidence of anaemia (figure 7N) or modification of haematopoietic progenitor populations (online supplementary figure S9A). Comprehensive bone marrow phenotyping revealed reduced B cell counts and neutrophilia both mirrored in PB (online supplementary figure S9B). Intriguingly, there was no DSB accumulation in both gut and liver samples, suggesting that healthy cells can properly respond to genotoxic stress induced by ATMi plus PAD (online supplementary figure S9C,D). Nevertheless, due to the low predictive value provided by rodent models, the potential human toxicity prediction of the PAD therapy and ATMi has to be taken with precautions. Moreover, our evaluation of adverse events mainly stressed on acute toxicities and was not directly assessing long-term side effects. Still, these results indicate that chemical and genetic ATM inhibition entails sensitivity to PAD treatment uncoupling its efficiency from a DDR deficient background with limited side effects in immunocompetent mice.

ATM inhibition sensitises PDAC patient-derived xenografts to PAD therapy. (A) Schematic representation of the subcutaneous assays shown in (C), (D) and (H) with treatment administration schedule. (B) Clinical characteristics and pathogenic mutations of patient-derived xenografts (PDXs) and of corresponding PDAC patients. Only class IV and V mutations are shown. (C) Waterfall plot showing best response of 10 PDXs to a combination of an ATM inhibitor (AZD0156, 2.25 mg/kg) and olaparib (50 mg/kg), VE-822 (20 mg/kg) and CC-115 (2.5 mg/kg) (PAD, PARPi/ATRi/DNA-PKi). Every bar represents one PDX. The horizontal dotted lines represent limits of progressive disease (PD, +20%), stable disease (SD, between +20% and −30%), and partial response (PR, −30%). (D) Time-dependent development (over the course of 16 days) of subcutaneously engrafted tumours arising from Panc354 PDXs treated or not (respectively, dashed lines and solid lines) with a combination of AZD0156 and PAD as in (C), with representative macroscopic images. Scale bars represent 5 mm. (E) Immunohistochemistry staining for H2AX p-S139 and cleaved caspase-3 (CC3), and (F) quantifications of H2AX p-S139-positive cells and (G) of CC3-positive surface in resected tumours from subcutaneous assay shown in (D). Scale bars represent 75 µm. (H) Time-dependent development (over the course of 16 days) of subcutaneously engrafted tumours arising from Panc163 PDXs treated or not (respectively, dashed lines and solid lines) with a combination of AZD0156 and PAD as in (C), with representative macroscopic images. Scale bars represent 5 mm. (I) Immunohistochemistry staining for H2AX p-S139 and cleaved caspase-3 (CC3), and (J) quantifications of H2AX p-S139-positive cells and (K) of CC3-positive surface in resected tumours from subcutaneous assay shown in (H). Scale bars represent 75 µm. (L) Schematic representation of the toxicity assay shown in (M and N) with treatment administration schedule. (M) Body weight progression (over the course of 14 days) and (N) complete blood count of C57BL/6J mice enrolled in the toxicity assay and treated with AZD0156 (2.25 mg/kg) and PAD (olaparib (50 mg/kg), VE-822 (20 mg/kg) and CC-115 (2.5 mg/kg)) as in (L). The horizontal red dashed line represents the weight loss ethical endpoint (−20%). DSB, double-strand break; PLT, platelets; RBC, red blood cells; TNM, tumour, nodes, metastasis classification; Veh, vehicle; WBC, white blood cells. *, p<0.05; **, p<0.01; ***, p<0.001.
A multi-layered mechanism secures PARP-inhibitor resistance in HR-deficient PDAC
Long-term maintenance monotherapy with PARPi has been shown to promote resistance acquisition as already shown for non-pancreatic tumours.10 47 To elucidate the mechanisms of olaparib resistance in ATM-deficient PDAC, PARPi-resistant cells (referred as PARPi-res-AKC in the text, abbreviated for illustrative reasons as R-AKC in figures) were generated (figure 8A). Resistance was confirmed with viability and clonogenicity assays, and persisted even after olaparib removal (figure 8B and C). PARPi-res-AKC cells exhibited impaired proliferation associated with accumulation of cells in G2/M phase, aneuploidy and increased genomic alterations (figure 8D–G). These observations together with persisting PARPi resistance beyond drug release suggest permanent genetic and not temporary alterations. Thus, we performed whole exome sequencing (WES) in a set of parental and PARPi-res-AKC cells revealing increased indels, but even more pronounced, a higher number of single-nucleotide variants (SNV) as well as copy number alterations (CNA) in the resistant counterparts (figure 8H). Intriguingly, we observed a structural aberration pattern with consistent amplification of a particular locus described as the Abcb1 amplicon48 in PARPi-res-AKC (figure 8I and J). Numerous genes are located at this locus (5 A1; 5 3.43 cM region in mouse genome; 7q21.12 region in human genome), for example, Abcb1, Abcb4, Sri, Dbf4, all previously associated with tumourigenesis and multidrug resistance (MDR) in various cancers.48 RNA sequencing followed by qPCR validation confirmed that structural amplification patterns in PARPi-res-AKC cells directly translate into a transcriptional upregulation of MDR genes including Abcb1 (Mdr1) and Abcg2 (Brcp) (figure 8K and L; online supplementary figure S10A-D). Moreover, we identified three glutathione S-transferase enzymes (eg, Gstp1, frequently overexpressed in cancer) upregulated in PARPi-resistant cells (figure 8M), suggesting an additional safe-guard due to an increased detoxification of eventually applied chemotherapy.49

PARP inhibitor resistance induces genomic instability and chromosomic rearrangements in ATM-deficient PDAC cells. (A) Schematic representation of PARPi-resistant Atmfl/fl; LSL-KrasG12D/+; Ptf1aCre/+ cells (R-AKC) generation. (B) Viability assay analysis of olaparib treatment (PARPi) in Atmfl/fl; LSL-KrasG12D/+; Ptf1aCre/+ (AKC), R-AKC and, R-AKC cells propagated without olaparib for 32 days (R-AKCw/o). (C) Colony formation assay on AKC and R-AKC cells treated with varying combinations of olaparib. (D) MTT assay-based cell growth of AKC and R-AKC cells (over the course of 7 days). (E) Cell cycle analysis by flow cytometry using DAPI DNA staining of AKC and R-AKC cells. (F) Direct fluorescence staining of DNA by DAPI (white) and (G) quantification of micronuclei in AKC and R-AKC cells. White arrows show micronuclei (M) and cytokinesis bridge (Cy). Scale bars represent 10 µm. (H) Whole exome sequencing-based evaluation of genomic alterations (SNV, single nucleotide variants; Indels, insertions/deletions; CNA, copy number alteration) in R-AKC versus AKC cell lines. (I) Whole exome sequencing-based copy number profiles for a parental AKC (upper panel) and respective R-AKC (lower panel) cell lines. (J) Whole exome sequencing-based copy number profile of the Abcb1 amplicon region for parental AKC and respective R-AKC cell lines. (K) RNA sequencing-based gene expression of six genes located at the Abcb1 amplicon, in R-AKC versus AKC cells. Data show log2 ratios obtained from three RNA sequencing technical replicates performed on the parental AKC and R-AKC cell lines used in (I). (L) qRT-PCR analysis of drug efflux transporters and (M) xenobiotic detoxification enzymes gene expression in AKC and R-AKC cells.
Drug resistance could additionally be accompanied by the acquisition of an epithelial-to-mesenchymal transition (EMT) programme16 50 and Atm deletion in PDAC has been shown to drive EMT.10 16 51 Indeed, PARPi-res-AKC cells appeared morphologically more mesenchymal than their parental counterparts (figure 9A). This observation was substantiated by transcriptional profiling (figure 9B; online supplementary figure S10A-C,E), EMT marker-based phenotyping (figure 9C and D), and migration assays (figure 9E). Of note, complex rearrangement patterns associated with mitotic errors can trigger the simultaneous escape of tumour subclones leading to highly aggressive PDAC.52 Accordingly, WES performed on these cells shows evidence that may indicate a clonal evolution during acquired resistance (online supplementary figure S11).

A multi-layered mechanism secures PARPi resistance in unstable PDAC. (A) Representative images of AKC and R-AKC cell lines. Scale bars represent 200 µm. (B) qRT-PCR analysis of epithelial-mesenchymal transition genes expression in AKC and R-AKC cells. (C) Western blot analysis and (D) quantification of CDH1, VIM and CDH2 levels of AKC and R-AKC cells. (E) Transwell migration assay performed with AKC and R-AKC cells. (F) Mini drug viability assay screening performed on R-AKC cells with increasing doses of 45 drugs. (G) Viability assay analysis on R-AKC cells treated or not with a combination of olaparib (1 µM), VE-822 (20 nM) and CC-115 (30 nM) (PAD, PARPi/ATRi/DNA-PKi) and a MDR1 inhibitor (elacridar). (H) qRT-PCR analysis of Lig1 gene expression in AKC and R-AKC cells. (I) Viability assay analysis on shScramble- (shScr) and shLig1-harbouring R-AKC cells treated with varying combinations of PAD and either a MDR1 inhibitor (elacridar) or a CYP3A/MDR1 inhibitor (clarithromycin). (J) Schematic representation of multi-layered PARP resistance in R-AKC cells. 5FU, 5-fluorouracil; AZD, AZD7762; CARB, carboplatin; CIS, cisplatin; DABR, dabrafenib; DECI, decitabine; DORS, dorsomorphin; DOXO, doxorubicin; DSB, double-strand break; EMT, epithelial-mesenchymal transition; ERLO, erlotinib; ETO, etoposide; EVER, everolimus; GEM, gemcitabine; GST, glutathione S-transferase; HR, homologous recombination; IRI, irinotecan; JAK, JAK inhibitor I; LAPA, lapatinib; METF, metformin; MIR, mirin; MITO, mitomycin C; MK, MK-1775; MLN, MLN4924; NAC, N-acetylcystein; NIRA, niraparib; NU, NU7026; OLA, olaparib; OXA, oxaliplatin; PACL, paclitaxel; PALB, palbociclib; PD, PD0325901; PD1, PD-1/PD-L1 inhibitor 1; PEME, pemetrexed; SB, SB431542; SELU, selumetinib; SORA, sorafenib; SUNI, sunitinib; TIV, tivantinib; TRAM, trametinib; Veh, vehicle; VENE, venetoclax; VINO, vinorelbine; VORI, vorinostat; WORT, wortmannin. *, p<0.05; **, p<0.01; ***, p<0.001; ****, p<0.0001.
To functionally probe this hypothesis, we re-challenged PARPi-res-AKC cells with the drugs from the customised screen described in figure 1B. Thereby, we confirmed genetic and transcriptional characteristics (figure 8I–M) of PARPi-res-AKC cells as most of the drugs, although active in parental counterparts, did not exert relevant activity in line with MDR (figure 9F). Notably, a variety of drugs are substrates of at least one of the described efflux transporters (eg, ABCB1 for olaparib and irinotecan). Additional proof is given by chemical inhibition of drug transporters (ABCB1 and ABCG2 inhibition with elacridar) that partially restored sensitivity towards PAD treatment (figure 9G). Lig1, a DNA ligase, was upregulated in PARPi-res-AKC cells suggesting a role for this DNA ligase in the resistance process (figure 9H; online supplementary figure S10A). Similarly, other established members of the DDR were upregulated in PARPi-res-AKC cells as Fancd2 (FA/BRCA pathway), Mgmt (MGMT-mediated DNA repair), and Paxip1 (NHEJ) (online supplementary figure S12A) suggesting that an upregulation of alternative DDR components may counteract the high levels of DNA damage. Nevertheless, drugs counteracting such remaining end-joining DSB repair pathways (alternative-end joining (A-EJ)) in AKC cells (figure 3E),21 such as DNA-PKi, DNA ligase 1/3 inhibitor (L67) or ATRi, were ineffective to overcome PARPi resistance as gamma radiation was, even with increased radiation doses up to 10 Gy (data not shown; online supplementary figure S12B). To functionally test the role of LIG1 in mediating treatment resistance, shRNA knockdown of LIG1 was performed in PARPi-res-AKC cells (online supplementary figure S12C). Interestingly, LIG1 knockdown increased the efficacy of PAD by partially restoring response (figure 9I). In line with the observed MDR, the efficacy of PAD in shLig1-PARPi-res-AKC cells is significantly improved when combined with elacridar or clarithromycin (inhibitor of ABCB1 and CYP3A) (figure 9I). These data show that prolonged PARPi monotherapy in ATM-deficient PDAC can cause a complex resistance mechanism, in which LIG1 plays a contributing role (figure 9J).
Discussion
DSBs require fast and efficient countermeasures such as HR to avoid lethality in cancer cells. This explains the rationale underlying single PARP inhibitor treatment in HRD tumours caused by mutations in, for example, BRCA1/2 or ATM. In line, PARPi (ie, olaparib) maintenance therapy has been recently reported as the first targeted therapy for germline BRCA1/2-mutated metastatic pancreatic cancer (POLO trial).12 However, BRCA1/2 mutations comprise only a subset of the so-called genomic unstable PDAC subtype,7 whereas mutant ATM accounts for approximately one-third of mutations in DDR genes. Moreover, in unselected cohorts, ATM mutations occurred as frequently as BRCA1/2 mutations in germline mutant PDAC. In fact, a recent study analysing sequencing data from germline blood and matched tumour tissue of 17 152 cancer patients found that PARP inhibitor sensitivity is determined by the cancer type and not by the somatic or germline origin of the BRCA1/2 mutation.53 Accordingly, breast, ovarian, prostate and pancreas cancer were classified as BRCA-associated cancer types displaying HR-deficiency and subsequent PARP inhibitor responsiveness.53 Conclusively, both a germline or somatic ATM mutation should cause HR-deficiency and attribute the same vulnerabilities to PDAC. Mechanistically, ATM deletion in PDAC indeed promoted HRDness with tumour cells relying on alternative DDR pathways such as SSA. In line, an HR to SSA shift is a common denominator of BRCA1/2-mutated cells and was also described in lymphoblastoid cell lines from ataxia-telangiectasia patients harbouring biallelic ATM mutations.54 Thus, targeted therapies for ATM-deficient PDAC or sensitising strategies to cause specific vulnerabilities in non-DDR-gene-mutated PDAC could be a relevant treatment modality. Here, we screened for drugs specifically targeting ATM-deficient PDAC (i) to identify candidates for subsequent synergistic interactions and (ii) to lower toxicity and increase efficiency on drug combination. The designed triple pathway inhibitor regimen (PAD) was similarly effective in a set of preclinical murine and human PDAC models including PDOs and PDXs. More precisely, the PAD regimen alone appeared to be generally effective in HR-deficient PDAC and leveraged BRCAness or better refined HRDness-like response rates in a genotype-independent manner on chemical ATM inhibition. Thereby, we demonstrate that sophisticated screening approaches taking advantage of both drug synergism and synthetic lethality across DDR-targeting therapies could open a new era for PDAC treatment. Finally, consequences of long-term PARP inhibition were elaborated in ATM-deficient PDAC together with respective strategies to overcome this problem. Thus, our study provides a potential roadmap to extend therapeutic options in different PDAC subtypes.
In this study, we identified several drugs that operate, either as single agents or in combination, as synthetically lethal with ATM-deficiency status. Intriguingly, among the conventional chemotherapeutics none acted in a genotype-specific manner except the TOP1 inhibitor irinotecan. This is in line with the role of the ATM/TDP1-pathway in TOP1 cleavage complexes removal from the DNA.32 Contrasting with BRCA1-mutant PDAC,7 ATM mutations do not entail higher sensitivity toward any platinum-based chemotherapy. As individual components of the FOLFIRINOX regimen were still effective, although not ATM-deficiency-tailored, this regimen should be considered first-line therapy for such patients. When we tested a set of targeted therapies, DNA repair inhibiting agents clearly stood out as the most effective single-agent treatments. However, in such a setting, DDR inhibitors frequently lack a sustained response pointing toward inherent/acquired resistance or a still sufficient DDR capacity to maintain DNA integrity. Notably, MEK inhibitors, previously described to act in an ATM-deficient specific manner in lung cancer, were not effective either alone or in combination with DNA repair inhibitors, indicating a different pathway addiction in PDAC. Our work rather aimed at designing a combinatorial drug regimen providing therapeutic benefit with retained tolerability, as illustrated by the toxicity assay performed in wild-type mice. In fact, treatment with an ATM inhibitor (ATMi) plus PAD induced leucopenia but no anaemia, demonstrating that this approach could be considered as a future leading concept in human PDAC treatment.55 However, it remains unclear to what extend our short-term treatment assay is capable to predict toxicity in humans likely requiring treatment for several months. Recent reports suggested PARP inhibition as a standard to maintain treatment response in genomically unstable PDAC at least in case of mutant gBRCA1/2 and preclinically also in ATM-deficient PDACs.10 Our customised drug screen also identified PARP inhibitors as the most effective backbone for a synergistic combinational therapy targeting the remaining DNA repair pathways in ATM-deficient PDAC. The endeavour to develop even more potent PARP inhibitors or to alternatively target PARG/PARylation56 will most likely extend and reinforce the potential of PARPi. Among DDR inhibitors, the highest PARPi synergism was observed with DNA-PKi and ATRi. The identification of this triangular synergism was aided by a newly developed, advanced computational tool allowing the assessment of distinct synergistic actions in a multidimensional space. Consistently, it was previously shown that ATM-deficient tumours rely on DNA-PKcs57 and that ATR deficiency, a key player in replication stress response, is associated with lethality in proliferating cells.35 Sole ATR or DNA-PKcs inhibition was reported as highly potent,58 yet often associated with severe side effects that could drastically limit their use. Here, by substantially lowering the dosage of inhibitors and combining them with PARPi, a highly efficient and tolerable synergistic cocktail against ATM-deficient PDAC was elaborated. Our study exploits the concept of replication fork stability as a predominant and synergistically attacked target of PAD.59 This efficacy can be explained by the reported effects of unscheduled origin firing due to ATR inhibition and DSB persistence at stalled forks due to inhibition of ATM and DNA-PK functions, which altogether exacerbate replicative stress and DNA damage finally leading to genomic instability and death. The consecutive PAD-induced apoptosis of ATM-deficient PDAC cells is at least partially mediated by P53, though a P53-independent mechanism as mitotic catastrophe may contribute to tumour control in TP53-mutated PDX. Nevertheless, some cells may escape the treatment and therefore will develop resistance to PARPi, phenotypically revealed by slow cell proliferation and aneuploidy. The latter most likely results from the PARP1/PARylation function in mitotic checkpoint regulation.36 56 So far, the mechanisms of PARPi resistance have not been studied in PDAC. The slowdown of mitosis progression in our PARPi-resistant cells (R-AKC) cells was associated with less PARPi cytotoxicity, explaining the initial acquisition step of resistance.36 Olaparib resistance is frequently associated with downregulation of genes such as 53BP160 or with BRCA reversion mutations.61 However, while in most of the BRCA studies only one resistance mechanism countermeasures cell death, PARPi treatment mounted several potential resistance levels at least in ATM-deficient PDAC, of which LIG1 was found to play a potential role. Interestingly, we also observed increased EMT in the AKC phenotype16 during evolution of PARPi resistance. Nevertheless, our work provides a list of roadmaps toward alternative elimination strategies of PARPi-resistant cells (R-AKC) cells either by inhibiting upregulated drug transporters or by targeting the alternative-end joining pathway. Fractionation and alternating treatment regimens could also be incorporated in the therapeutic settings.62 Thus, our data suggest that PARPi monotherapy needs to be monitored with caution since it can trigger a general drug resistance inevitably rendering subsequent strategies inefficient. In summary, we provide data that a new therapeutic regimen, PAD, can be exploited to effectively target ATM-mutant human PDAC, and in combination with ATM inhibition, may extend the use of the PAD regimen to treat non-HRD pancreatic cancer.
Data availability statement
Data are available upon reasonable request.
Ethics statements
Patient consent for publication
Acknowledgments
We are deeply grateful to Kuhn Elektro-Technik GmbH for supporting our research to fight pancreatic cancer. The authors thank Alica K Beutel, Lisa Hamann, Lisa Hofbauer, Katrin Köhn, Ralf Köhntop, Claudia Längle, Michael K Melzer, Aref Saed, Lakshmi Sarojam, Elena Tschistjakow, Sandra Widmann and Eleni Zimmer for their outstanding technical support. They also thank Prof Thomas F E Barth for his expertise and his input on human pathology. The authors thank Kristina Diepold for her technical assistance in in vivo chorioallantoic membrane assays, Sarah Kostezka for quantification of DNA fibre assay images, Dr Tim Eiseler for helpful scientific exchange, Katherine Lindsay for her help with English editing and for scientific discussions and Dr Sarah Warth from the Core Facility Cytometry, Ulm University Medical Center for her technical assistance in FACS. The authors thank the animal facility platform Tierforschungszentrum, Ulm University, and its members for animal care.
References
Footnotes
JG and LP contributed equally.
P-OF and AK contributed equally.
Contributors Conception and design: JG, LP, MM, LW, P-OF and AK. Development of methodology: JG, LP, MM, FA, MI, SB, SL, TE, SM and P-OF. Acquisition of data (provided animals, acquired and managed patients, provided facilities, and so on): JG, LP, MM, FA, MI, SB, SL, KS, SAH, AZ, TE, KW, ER-A, BS, PCH, EH, SM, NA, AL, DS and P-OF. Analysis and interpretation of data (eg, statistical analysis, biostatistics, computational analysis): JG, LP, MM, FA, MI, SL, SB, SL, ER, JMK, TE, SM, MW, HAK, LW and P-OF. Writing, review and/or revision of the manuscript: JG, LP, MM, FA, MW, DS, TS, LW, RR, P-OF and AK. Administrative, technical or material support: JG, LP, MM, FA, MI, SB, SL, TE, MMü, SM and P-OF. Study supervision: P-OF and AK.
Funding Main funding is provided by the German Cancer Aid grant to AK (111879). Additional funding came from the Deutsche Forschungsgemeinschaft (DFG) 'Sachbeihilfe' (KL 2544/1–1, 1–2, 5–1, 7-1) and 'Heisenberg-Programm' (KL 2544/6–1), the Baden-Württemberg-Foundation ExPoChip and the INDIMED-Verbund PancChip. AK, FA, MI, SB, LW and TS are either Principal Investigators or students of HEIST RTG funded by the DFG GRK 2254/1. AK is an Else-Kröner-Fresenius Excellence fellow. LP received funds by the Bausteinprogramm of Ulm University. PCH is supported by a Max Eder Fellowship of the German Cancer Aid (111746), a German Cancer Aid Priority Program 'Translational Oncology' 70112505 and by a Collaborative Research Centre grant (316249678 – SFB 1279) of the German Research Foundation. EH received funding from the German Cancer Aid (PiPAC, 70112505) and the Volkswagenstiftung/Ministry for Science and Culture in Lower Saxony (ZN3222). This work was also supported by the Deutsche Forschungsgemeinschaft (AZ.96/1–3) to NA, by the Deutsche Krebshilfe (111264) to AL and by the German Cancer Aid Priority Program Translational Oncology (70112504) to LW.
Competing interests None declared.
Patient and public involvement Patients and/or the public were not involved in the design, or conduct, or reporting, or dissemination plans of this research.
Provenance and peer review Not commissioned; externally peer reviewed.
Supplemental material This content has been supplied by the author(s). It has not been vetted by BMJ Publishing Group Limited (BMJ) and may not have been peer-reviewed. Any opinions or recommendations discussed are solely those of the author(s) and are not endorsed by BMJ. BMJ disclaims all liability and responsibility arising from any reliance placed on the content. Where the content includes any translated material, BMJ does not warrant the accuracy and reliability of the translations (including but not limited to local regulations, clinical guidelines, terminology, drug names and drug dosages), and is not responsible for any error and/or omissions arising from translation and adaptation or otherwise.