Article Text

Abstract
Objective To monitor trastuzumab resistance and determine the underlying mechanisms for the limited response rate and rapid emergence of resistance of HER2+ metastatic gastric cancer (mGC).
Design Targeted sequencing of 416 clinically relevant genes was performed in 78 paired plasma and tissue biopsy samples to determine plasma-tissue concordance. Then, we performed longitudinal analyses of 97 serial plasma samples collected from 24 patients who were HER2+ to track the resistance during trastuzumab treatment and validated the identified candidate resistance genes.
Results The results from targeted sequencing-based detection of somatic copy number alterations (SCNA) of HER2 gene were highly consistent with fluorescence in situ hybridisation data, and the detected HER2 SCNA was better than plasma carcinoembryonic antigen levels at predicting tumour shrinkage and progression. Furthermore, most patients with innate trastuzumab resistance presented high HER2 SCNA during progression compared with baseline, while HER2 SCNA decreased in patients with acquired resistance. PIK3CA mutations were significantly enriched in patients with innate resistance, and ERBB2/4 genes were the most mutated genes, accounting for trastuzumab resistance in six (35.3%) and five (29.4%) patients in baseline and progression plasma, respectively. Patients with PIK3CA/R1/C3 or ERBB2/4 mutations in the baseline plasma had significantly worse progression-free survival. Additionally, mutations in NF1 contributed to trastuzumab resistance, which was further confirmed through in vitro and in vivo studies, while combined HER2 and MEK/ERK blockade overcame trastuzumab resistance.
Conclusion Longitudinal circulating tumour DNA sequencing provides novel insights into gene alterations underlying trastuzumab resistance in HER2+mGC.
- gastric cancer
- HER2
- trastuzumab resistance
- ctDNA
- next-generation sequencing
- NF1
Statistics from Altmetric.com
Significance of this study
What is already known on this subject?
The response rate of HER2-positive gastric cancer (GC) to trastuzumab is limited, and resistance occurs rapidly during treatment. Liquid biopsy-based circulating tumour DNA (ctDNA) profiling provides the potential to monitor gene alterations during trastuzumab treatment of advanced or metastatic GC.
Currently, the underlying mechanism of trastuzumab resistance remains unclear, and strategies to overcome resistance are urgently needed.
What are the new findings?
Liquid biopsy-based ctDNA profiling promisingly predicted tumour shrinkage and progression, and the underlying mechanisms of innate resistance and acquired resistance to trastuzumab might differ, due to the differences in HER2 copy numbers. PIK3CA/R1/C3 or ERBB2/4 mutations exhibited substantial contributions to resistance and resulted in a poor progression-free survival, while the ERBB4 S774G mutation increased the sensitivity to trastuzumab therapy.
Furthermore, NF1 was identified and confirmed as a gene related to resistance, and a combination of HER2 and MEK/ERK inhibitors might overcome trastuzumab resistance.
How might it impact on clinical practice in the foreseeable future?
We propose that ctDNA profiling provides helpful information to monitor the occurrence, dissect the potential molecular mechanisms and provide helpful insights into the development of therapies for trastuzumab resistance.
Introduction
Gastric cancer (GC) is the fourth most common cancer and the second leading cause of cancer-related mortality worldwide.1 In China, where GC is endemic,2 3 40% of patients are diagnosed with advanced or metastatic GC (mGC) and have poor prognoses.4 5
Human epidermal growth factor receptor 2 (HER2, also known as ERBB2) is a transmembrane receptor tyrosine kinase, and its overexpression/amplification (HER2 positive, HER2+) is present in approximately 6.1%–23.0% of GCs.6–9 Several studies have confirmed the efficacy of trastuzumab for HER2+ mGC.9 10 The ToGA study was the first trial to show that trastuzumab in combination with chemotherapy could significantly improve the overall survival (OS) of patients with HER2+ mGC. However, despite the survival benefit achieved with trastuzumab, the addition of trastuzumab to chemotherapy only increased the overall response rate by 12.8% and increased progression-free survival (PFS) by 1.2 months.9 This observed unsatisfactory survival prolongation may be explained by a limited initial response or by acquired resistance to trastuzumab for patients with HER2+ mGC. Therefore, understanding the potential molecular mechanisms of intrinsic and acquired resistance to trastuzumab is critical to identifying patients who would likely respond to treatment and to finding new treatment strategies to overcome drug resistance.
GC harbours intensive intrinsic molecular heterogeneity,11 12 which might be a critical driver of the resistance to targeted therapy.13 Furthermore, the genomic profiles of primary tumours and metastases are not always concordant, and tumour tissues are difficult to obtain.14 Thus, circulating tumour DNA (ctDNA) provides good opportunities for longitudinal sequencing and analysis.15–18 Such liquid biopsy ctDNA profiling can be used to dissect intrinsic trastuzumab resistance due to primary tumour heterogeneity and to track acquired resistance to trastuzumab due to the emergence of novel molecular aberrations.
In this study, a panel comprising 416 cancer-related genes was sequenced to determine the plasma ctDNA profiles of patients with GC. Matched pairs of tissue and plasma samples from 78 patients were used to evaluate the consistency of detection between the ‘liquid’ and ‘solid’ biopsies, while time-course plasma samples from 24 patients who were HER2+ treated with trastuzumab plus chemotherapy were used to monitor resistance. The results showed that the ctDNA-based detection of HER2 somatic copy number alterations (SCNA) was consistent with the tissue profile, while HER2 SCNA could serve as indicators of trastuzumab resistance. Several known resistance-related genes, namely, PI3KCA/R1/C3, ERBB2 and ERBB4, were identified, and NF1 was identified as a novel gene underlying trastuzumab resistance. Overall, longitudinal next generation sequencing (NGS)-based ctDNA profiling efficiently monitored tumour evolution and identified mechanisms of trastuzumab resistance.
Methods
Patients and sample collection
Seventy-eight GC cases for which matched pairs of tissue and blood samples were available and 24 patients who were HER2+ with mGC who received treatment with trastuzumab plus chemotherapy were evaluated in the present study (online supplementary methods).
Supplementary file 1
Sequencing and bioinformatics analysis
Tumour tissues or plasma DNA from 102 patients with GC were analysed using a customised panel of 416 cancer-related genes. For further details, see the online supplementary methods section.
Cell viability assay and animal study
Cell viability was measured in three independent replicates 72 hours after drug treatment using MTS assays according to the manufacturer’s instructions.19 For the animal study, a xenograft model comprising SNU-216-NC and SNU-216-sh#NF1 cells was established in athymic nude mice, and the mice were treated with PBS, lapatinib alone, selumetinib alone or a combination of lapatinib and selumetinib (online supplementary methods).
Results
Molecular alterations in tumour and liquid biopsies from patients with gastric cancer
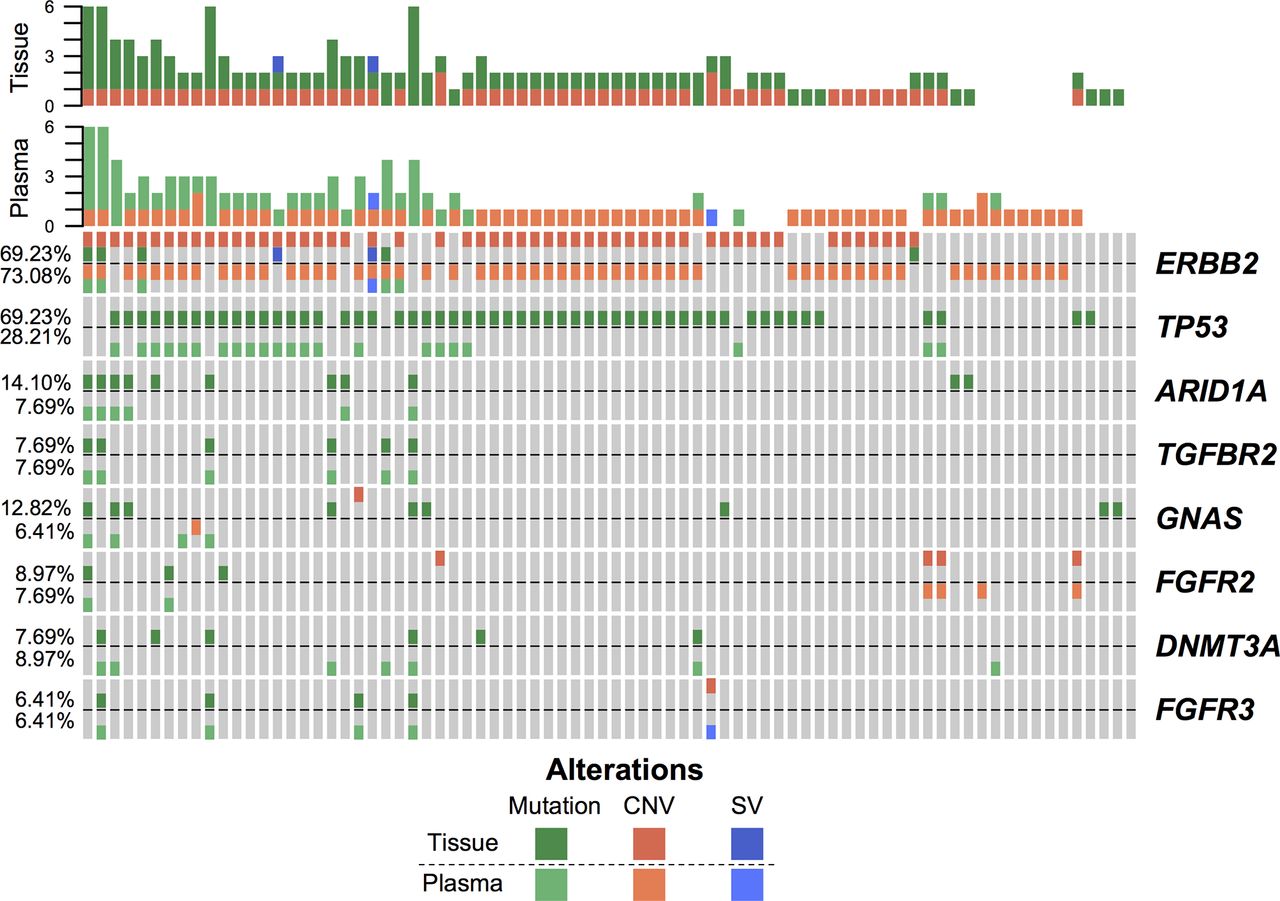
To evaluate the consistency between the detected molecular alterations in tumour and plasma, we sequenced genes from a cohort of 78 patients with GC (46 HER2+ and 32 HER2-) based on a panel comprising 416 genes. The copy number alterations, mutations and structural variations of DNA isolated from 78 tumour tissues paired with matched normal peripheral blood were analysed. The clinical characteristics are summarised in online supplementary table 1. The landscapes of the detected high-frequency (>5%) molecular alterations in the tissue and plasma are shown in figure 1 and online supplementary figure S1A, respectively. We observed that consistently, ERBB2 and TP53 were the most frequently altered genes in both the tissues and plasma, while heterogeneity was also obvious (figure 1). For example, HER2 amplification was observed in 54 (69.23%) tissues and 58 (74.36%) plasma samples, while overlapping results were observed in 41 patients (online supplementary figure S1B). For mutation identification, generally, tissue-based detection methods identified more mutations, and the number of detected mutations in tissue and plasma samples were highly correlated (online supplementary figure S1C). TP53 mutations were detected in 54 (69.23%) tissues and 22 (28.21%) plasma samples, including 21 paired samples (online supplementary figure S1D). Although the overall concordance rate was low, we further observed that the concordance rate increased with the stage, and the proportion of consistent TP53 mutation detections between tissue and plasma samples was 71.43% for mGC (Stage IV) (online supplementary figure S1E). Furthermore, the mutation allele frequencies (MAFs) in tumour tissues from patients in whom TP53 mutations were detected in both tissue and plasma samples were higher than those detected only in tissue samples (online supplementary figure S1F). Taken together, the molecular alterations detected in plasma provided a good representation of the status in the tumour tissue, particularly at advanced stages.
Supplementary file 2
Supplementary file 3

The landscape of high-frequency molecular alterations detected in plasma and the alterations detected in paired tissue samples is presented.
Since HER2 amplification was the major marker of HER2+ GC, the consistency between tissue-based sequencing, ctDNA and fluorescence in situ hybridisation (FISH) was dissected. Among the 78 paired samples, 23 were HER2+++ and 23 were HER2++/FISH+. As shown in online supplementary figures S2A and S2B for tissue and plasma, respectively, the detected HER2 copy numbers by FISH in the samples detected as HER2 amplified were significantly higher than those in the samples classified as non-amplification. As shown in online supplementary figure S2C, the copy numbers of the tissue and ctDNA were significantly correlated with a Spearman correlation coefficient of 0.39 (p=0.00039). Furthermore, we performed sequencing-based HER2 amplification detection to predict the FISH assay results. As shown in online supplementary figure S2D, the calculated HER2 copy number based on sequencing was a good representation of the HER2 amplification status with area under receiver operating characteristic curve values of 0.8764 and 0.7317 for tissue and plasma, respectively. Thus, plasma-based ctDNA profiling might provide insights into HER2 amplification in the tumours of patients with HER2+ GC.
Supplementary file 4
HER2 amplification in trastuzumab resistance
Ninety-seven serial plasma samples from 24 patients with HER2+ mGC who received treatment with trastuzumab plus chemotherapy were used for ctDNA profiling. The clinical characteristics are summarised in online supplementary tables 2 and 3, and the detected molecular alterations and their MAFs in ctDNA are presented in online supplementary table 4. Among these samples, 17 cases had progressed with trastuzumab therapy, while the other 7 cases were still being treated. Among the 17 progressed cases, 14 cases developed acquired resistance PFS>3 months) and 3 cases developed innate resistance (PFS≤3 months). The tumour load estimated by imaging using RECIST V.1.1, carcinoembryonic antigen (CEA) levels and mutation burden are also provided in supplementary table 4, and the CEA levels, copy number and mutation burden of the 17 progressed cases presented similar patterns during treatment (supplementary figure S3). We calculated the correlations between tumour load dynamics and these indicators. As shown in figure 2A, the HER2 copy number and mutation number were highly correlated with tumour load and better than CEA at predicting the tumour shrinkage.
Supplementary file 5
Supplementary file 6

(A) The consistency between tumour burden and indicators, including CEA, HER2 SCNA and mutation burden. (B) The distribution of potential trastuzumab resistance clones for tumour progression. (C) The detected HER2 copy number at baseline, during treatment and at progressive disease (PD). (D) The detected HER2 copy number at baseline and PD.
Since tumour heterogeneity was critical for drug resistance and because HER2-amplified subclones were preferentially targeted by trastuzumab therapy, we analysed the potential trastuzumab resistance clone on progression (figure 2B). Among the 17 progressed patients, HER2 were detected as amplified at both baseline and PD in 10 cases (59%), in which the drug resistance clone might have emerged from an HER2 amplification clone through other alterations to overcome trastuzumab treatment. In another four cases (23%), HER2 amplification was detected at baseline but not PD, which indicated that the HER2 amplification clone might have been eliminated during trastuzumab treatment and that resistance was driven by other non-HER2 amplification clones. There was one case (6%) in which HER2 amplification was detected at PD but not baseline, and the amplification of MET and STAT3 was also observed during treatment. Thus, the mechanism and clone evolution for trastuzumab resistance might be miscellaneous. Generally, the HER2 copy number decreased during treatment compared with baseline and PD levels (p<0.05), indicating that trastuzumab efficiently killed the HER2 amplification clone (figure 2C). Furthermore, the HER2 copy numbers at PD were higher than those at baseline for the three patients with innate resistance but lower for the 14 patients with acquired resistance (p=0.0591) (figure 2D).
ctDNA profiling reveals various mechanisms of trastuzumab resistance
Based on the detected molecular alterations from the ctDNA profiled from plasma, we dissected the potential mechanism of trastuzumab resistance. The landscape of the detected high-frequency mutations (>5%) in innate and acquired resistance is presented in online supplementary figures S4 and S5, respectively. Although considerable consistency was present, differences in the detected molecular alterations between baseline and PD were obvious (online supplementary figures S4 and S5). Time-series visualisations are shown in online supplementary figure S6 to further examine the detailed dynamics of molecular alterations occurring during trastuzumab treatment (online supplementary file 1).
Supplementary file 9
Supplementary file 10
Previously, a few studies have proposed that multiple genes, including FGFR(s), MET, MYC, STAT3, PI3K(s), ARID1A, AXL, ATM, mTOR/TSC2 and SRC, might be involved in trastuzumab resistance. Similar to these previous studies, we defined the resistance-related molecular alterations as emergent or abundance-increased during treatment. The detected alterations of the potential trastuzumab resistance-related genes are summarised in figure 3A. As shown in figure 3B, in 13 (76.5%) cases, the molecular alterations of these genes were emergent or abundance-increased during treatment and might have been responsible for trastuzumab resistance. An ERBB2 mutation was the most frequent mechanism and was observed in four patients both at baseline and in the progression plasma samples (figure 3A). Two patients had mutations in both ERBB2 and PIK3CA/R1/C3. ERBB4-activating mutations were identified in three patients at baseline and in two patients at PD. Two patients harboured a STAT3 amplification at the baseline, while one patient displayed this alteration together with a MET amplification at PD. ERBB2 amplification and ERBB2/4 and PIK3CA/R1/C3 mutations were among the most frequent alterations associated with trastuzumab resistance (figure 3C). Specifically, the PIK3CA mutation was more frequent in patients with innate resistance (2/3, 66.6%) (figure 3C), which suggests that the detection of PIK3CA mutations before trastuzumab therapy would allow the identification of patients who are likely to harbour innate resistance.
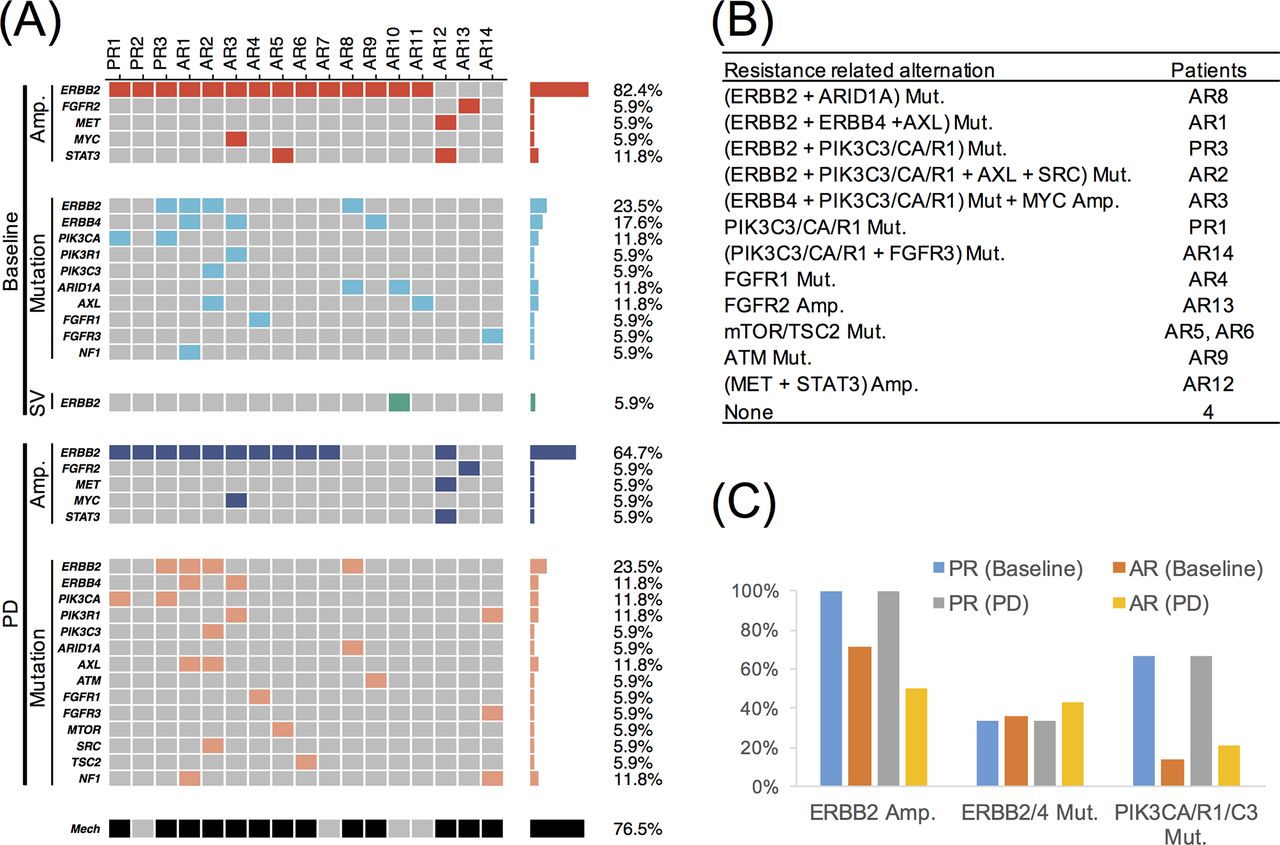
(A) The detected molecular alterations on known trastuzumab resistance-related genes at baseline and PD. (B) Summary of potential mechanisms for trastuzumab resistance. (C) The alterations in ERBB2/4 and PIK3CA/R1/C3.
PIK3CA/R1/C3 and ERBB2/4 mutations indicate rapid progression under trastuzumab therapy
Since PIK3CA/R1/C3 and ERBB2/4 were the most frequent genes associated with progression, we analysed the alterations in ERBB2/4 and PIK3CA/R1/C3 in detail. For PIK3CA, R88Q and E545K were detected at both the baseline and PD time points in two patients with innate resistance, while E542K was detected in a patient who had not yet reached PD. R88Q is located in the adaptor-binding domain (ABD) domain, and E545K is located in the helical domain (figure 4A). A previous study showed that R88Q and E545K activated PIK3CA.20 21 However, the consequence of the E542K mutation remains unknown. PIK3R1 N707S and PIK3C3 T488A mutations, whose functions are unknown, were observed in two patients with acquired resistance. In total, four patients (16.7%) harboured at least one SNV in PIK3CA/R1/C3 (figure 3A). Patients with PIK3CA/R1/C3 mutations in their baseline plasma samples had a significantly worse PFS than the carriers of the wild-type alleles (median PFS, 2.567 and 10.667 months, respectively; p<0.0001) (figure 4B).
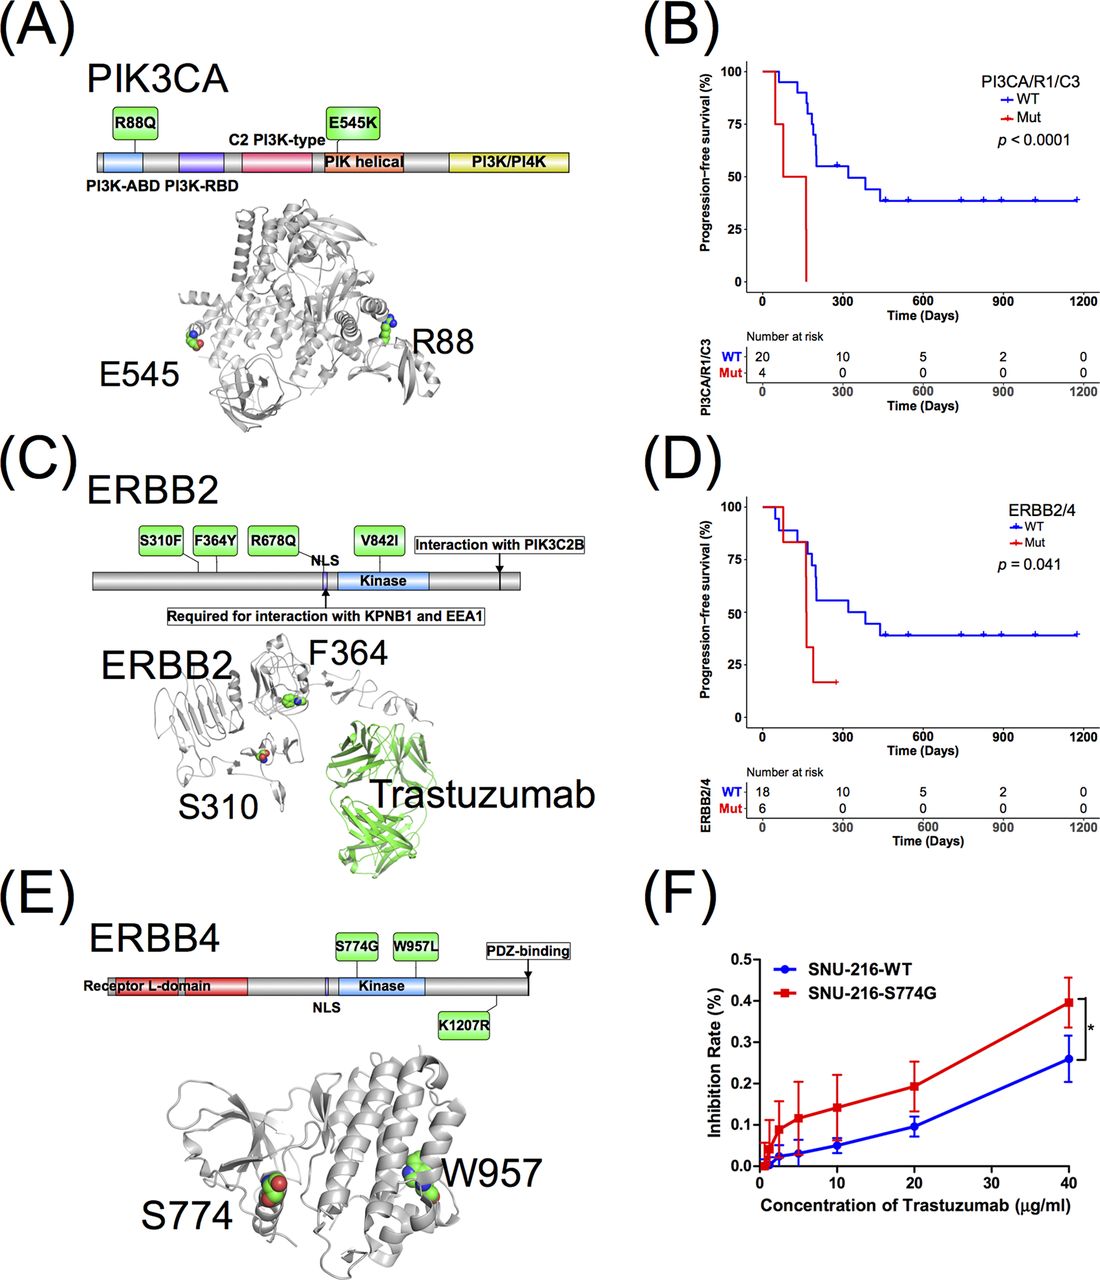
(A) The summary of PIK3CA mutations. (B) Progression-free survival analysis for PIK3CA/R1/C3 mutation. (C) The summary of ERBB2 mutations. (D) Progression-free survival analysis for ERBB2/4 mutations. (E) The summary of ERBB4 mutations. (F) The S774G mutation in ERBB4 increases sensitivity to trastuzumab therapy, * indicates a statistically significant difference compared with 10, 20 and 40 µg/mL trastuzumab, p<0.05 (Student’s t-test).
For ERBB2/4, six trastuzumab resistance-related mutations were detected in the baseline plasma samples from six (25%) patients (figure 3A). S310F, F364Y, R678Q and V842I were found in ERBB2, and a previous study showed that S310F and V842I were activating mutations22 23 (figure 4C). The presence of ERBB2/4 mutations predicted poorer PFS than wild-type patients (median PFS, 5.433 and 10.667, respectively; p=0.041) (figure 4D). For ERBB4, two patients with ERBB4 K1207R and W957L mutations (figure 4E) had poorer PFS than ERBB4 wild-type patients. These results suggested that the ERBB4 K1207R and W957L mutations play key roles in trastuzumab resistance. Interestingly, the ERBB4 S774G mutation (figure 4F) was detected at baseline but was absent after treatment. The patient with this mutation showed a trend towards longer PFS than ERBB4 wild-type patients and significantly longer PFS than the patients with the ERBB4 K1207R and W957L mutations. Thus, we proposed that the ERBB4 S774G mutation increased sensitivity to trastuzumab therapy. The hypothesis was confirmed by an in vitro analysis, in which the HER2-positive cell line SNU-216 became significantly more sensitive to 10, 20 and 40 µg/mL trastuzumab when transfected with the S774G mutant vector (p<0.05, Student’s t test) (figure 4F).
NF1 mutation contributes to trastuzumab resistance
In addition to the known genes associated with trastuzumab resistance, we explored other genes that might contribute to driving resistance. The emergence of the NF1, BAP1, CSF1R, GNAS and THADA mutations at PD in at least two patients was observed (online supplementary figure S5). A previous study has established that NF1 loss is common in cutaneous melanoma and is associated with resistance to RAF inhibition.24 Intriguingly, we observed two distinct trastuzumab resistance-related mutations in NF1 in two patients (figure 5A), suggesting NF1 as a new candidate resistance mechanism. A novel NF1 E217X mutation was identified in patient AR1. The relative allele fraction of the mutation compared with the dominant clone increased over the course of therapy (online supplementary figures S5 and S6 (AR1)), while the A3T mutation in the NF1 gene emerged at progression (online supplementary figures S5 and S6 (AR14)). In AR1, a subclone with activating mutations in NF1, CSF1R, CDK12, TET2, ERBB2 and ERBB4 that were detected before treatment increased over the course of therapy (online supplementary figure S6 (AR1)). In AR14, a subclone with a MAP2K4 mutation initially disappeared and later re-emerged, while the abundances of PIK3R1 and NF1 mutations varied over time (online supplementary figure S6 (AR14)). The estimation of cancer cell fractions (CCF) further confirmed the results (online supplementary figure S7A,B). The CCF for NF1 mutations in AR1 and AR14 at progression were 17.1% (online supplementary figure S7A) and 7.5% (online supplementary figure S7B), respectively. Droplet digital PCR (ddPCR) experiments were performed and confirmed the NF1 E217X mutation in AR1, with a MAF of 1.42% (online supplementary figure S7A), and only two positive droplets for the NF1 A3T mutation were detected due to the extremely limited amount of DNA sample remaining after sequencing (online supplementary figure S7B). These results confirmed the NF1 mutations in AR1 and AR14 (online supplementary figure S7C).
Supplementary file 8
Supplementary file 11

(A) NF1 downregulation activates MAPK pathway signalling. NF1-silenced NCI-N87 and SNU-216 cells maintain MEK/ERK phosphorylation in the presence of lapatinib (0.2 µM, 24 hours), and signalling is abolished by the combination of lapatinib and MEK/ERK inhibitor selumetinib (1 µM, 24 hours). (B) Schematic diagram showing how the cotargeting of HER2 and ERK resensitises HER2 +gastric cancer to trastuzumab. NF1-silenced NCI-N87 (C) and SNU-216 (D) cells are insensitive to anti-HER2 therapy alone, show moderate effects after treatment with the MEK/ERK inhibitor selumetinib alone compared with NF1-silenced cells and are more sensitive to the combination drug treatment.
Two short hairpin RNAs (shRNAs #1 and #2) targeting non-overlapping regions of the NF1 coding sequence25 and a non-silencing scrambled shRNA (shSC) as a control were transfected into NCI-N87 and SNU-216 cells to validate the possible role of NF1 (online supplementary figure S7D). Both NF1-targeting shRNA constructs decreased sensitivity to HER2 blockade, as determined using MTS assays (online supplementary figure S7E). The results demonstrated that NF1 silencing conferred the resistance of NCI-N87 and SNU-216 cells to HER2 blockade. In an in vitro model, NF1 loss abrogated negative feedback on MEK/ERK activation, resulting in an elevated activation of MEK/ERK and resistance to anti-HER2 treatment (figure 5A). Lapatinib failed to fully inhibit RAS-ERK signalling when NF-1 levels were reduced. Given these observations, we hypothesised that a combination therapy targeting both HER2 and the MEK/ERK pathway could overcome pathway activation and anti-HER2 treatment resistance (figure 5B). When we concurrently treated NF1-/HER2 +cells with lapatinib and the MEK/ERK inhibitor selumetinib, selumetinib sensitivity and downstream pathway suppression were restored (figure 5C,D). These results revealed that MEK/ERK pathway inhibition in combination with HER2 blockade resensitised trastuzumab-resistant shNF1-infected NCI-N87 and SNU-216 cells in vitro. We further examined the sensitising effect of MEK/ERK inhibition for anti-HER2 treatment in vivo using a tumour xenografts model. We established xenografts of SNU-216 cells stably infected with a control (shSC) or NF1-targeting (shNF1#1) shRNA. When the tumours were detectable, mice were treated with either a vehicle control, lapatinib, selumetinib or a combination of both drugs. The lapatinib and selumetinib combination treatment effectively reduced the tumour growth of both the NF1-silenced and control groups (figure 6A). As expected, we did not observe a response to lapatinib alone in the NF1 knockdown tumours, whereas selumetinib alone had a moderate effect on the NF1 knockdown tumours (figure 6B–C). These data suggest that the MEK/ERK inhibitor may resensitise tumours with reduced NF1 expression to anti-HER2 treatment in HER2+ GC.

![[gutjnl-2018-316522supp003.jpg]](https://gut.bmj.com/content/gutjnl/68/7/1152/DC3/embed/inline-supplementary-material-3.jpg?download=true)
![[gutjnl-2018-316522supp004.jpg]](https://gut.bmj.com/content/gutjnl/68/7/1152/DC4/embed/inline-supplementary-material-4.jpg?download=true)
![[gutjnl-2018-316522supp006.jpg]](https://gut.bmj.com/content/gutjnl/68/7/1152/DC6/embed/inline-supplementary-material-6.jpg?download=true)
![[gutjnl-2018-316522supp007.jpg]](https://gut.bmj.com/content/gutjnl/68/7/1152/DC7/embed/inline-supplementary-material-7.jpg?download=true)
![[gutjnl-2018-316522supp009.jpg]](https://gut.bmj.com/content/gutjnl/68/7/1152/DC9/embed/inline-supplementary-material-9.jpg?download=true)
![[gutjnl-2018-316522supp010.jpg]](https://gut.bmj.com/content/gutjnl/68/7/1152/DC10/embed/inline-supplementary-material-10.jpg?download=true)
(A) Therapeutic effect of lapatinib combined with selumetinib in a xenograft model of SNU-216-NC and SNU-216-sh#NF1 cells in athymic nude mice. The doses of each group were as follows: control (PBS); lapatinib (50 mg/kg, twice per day); selumetinib (25 mg/kg, twice per day); combination (lapatinib, 50 mg/kg and selumetinib, 25 mg/kg, twice per day). The tumours were excised and weighed, and representative pictures of each group were obtained after treatment. (B) The administration of the combination lapatinib and selumetinib treatment for 25 days effectively reduced the tumour growth of both the NF1-silenced and control tumours. (C) The NF1 knockdown tumours were resistant to lapatinib alone, whereas selumetinib alone had a moderate effect on the NF1 knockdown tumours. The tumour volumes were measured every 4 days, and a tumour growth curve was generated for each group. Dots, mean tumour volume; bars, SD; *P<0.01. The tumour weights (n=5) of the eight groups are represented as individual dots. Solid lines indicate the mean of each group. P values were calculated using Student’s t-test.
Discussion
GC is a genomically heterogeneous disease. Due to the biological complexity and dynamic nature of therapeutic resistance, sampling a single site of the disease can never fully assess the clonal complexity of multisite metastatic disease in patients. Therefore, ctDNA is useful for detecting the genomic alterations present in genomically heterogeneous metastatic sites. Previously, Shoda et al achieved substantial progress in monitoring the HER2 copy number using ctDNA-based ddPCR.26 To the best of our knowledge, our study is the first to show that high-throughput sequencing-based serial ctDNA genotyping is an efficient approach to monitor resistance to trastuzumab and identify emerging mechanisms of resistance in HER2+ GC.
In this study, we found that the dynamics of HER2 copy number variations (CNVs) were better at predicting the response to trastuzumab than CEA. The persistence or recurrence of HER2-amplified copies in the blood indicates resistance-related tumour progression. Our study is the first to propose ctDNA-based HER2-amplified copies to determine resistance to trastuzumab treatment in HER2+ GC.
Several potential mechanisms of trastuzumab resistance have been proposed. Antibody-dependent cellular cytotoxicity via interactions with Fc-γ receptors expressed on immune effector cells may contribute to trastuzumab sensitivity.27 The most prevalent de novo resistance mechanisms include the constitutive activation of the PI3K pathway due to PIK3CA mutations28 or PTEN loss29 and the expression of p95HER2, a truncated form of the HER2 receptor that lacks an extracellular trastuzumab-binding domain.30 The activation of other RTKs, such as HER1,31 HER3,32 IGF-1R 32 33 and MET,32 34 also contributes to both de novo and acquired resistance. Heterotrimerisation of the receptors ERBB2, ERBB3, ERBB4 and IGF-1R may redundantly trigger cell proliferation signalling pathways and confer resistance to trastuzumab.35 36 In the NGS-based ctDNA analysis of the present study, we found evidence for multiple resistance mechanisms in 76.5% of patients. Importantly, we found that patients who developed multiple resistance mechanisms (PIK3CA/R1/C3 and ERBB2/4) displayed significantly shorter PFS when treated with trastuzumab. These findings indicate that ctDNA can more effectively capture the heterogeneity of acquired resistance mechanisms.
We observed a number of previously unreported resistance mechanisms to trastuzumab in HER2+ GC, including a novel mutation in ERBB4 and the emergence of NF1 mutations in patients following trastuzumab therapy. Based on our results, patients with the ERBB4 S774G mutation showed a trend towards longer PFS than patients with wild-type ERBB4 and a significantly longer PFS than patients with the ERBB4 K1207R and W957L mutations. These results are the first to suggest that the ERBB4 mutation plays a key role in mediating resistance to ERBB2 inhibitors in HER2+ GC.
Using in vitro and in vivo models, NF1 loss abrogated negative feedback on MAPK activation, resulting in an elevated activation of pMEK/ERK and resistance to anti-HER2 treatment. Combined HER2 and MEK/ERK blockade may resensitise tumours with reduced NF1 expression to anti-HER2 treatment, suggesting that NF1 mutations/deletions can be used as potential molecular markers of resistance to trastuzumab. However, the NF1 gene encodes a RAS GTPase-activating protein known as neurofibromin and is one of several genes that (when loss-of-function mutations are present) affect RAS-MAPK signalling, causing related diseases collectively known as RASopathies.37 Somatic NF1 mutations also occur in 5%–10% of human sporadic cancers,37 38 and NF1 activation is a known mechanism that confers resistance to EGFR inhibition in lung cancer.25 Moreover, the loss of NF1 is common in cutaneous melanoma and is associated with resistance to RAF inhibition.24 To the best of our knowledge, this is the first report of emergent NF1 mutations in HER2+ GC following treatment with trastuzumab.
Although ctDNA profiling potentially provides helpful information to dissect the potential molecular alterations associated with trastuzumab resistance, the technique has several limitations. First, although our 416-gene panel covered the majority of solid tumour-related genes, the patient may have developed a mutation in a certain gene that was not covered by our panel or the function of protein encoded by certain gene was regulated at the transcriptional, translational or even post-translational level and thus was not detected by DNA sequencing. Second, cell-free DNA (cfDNA) from plasma contains both cfDNA released from normal cells and the ctDNA from limited tumour cells, causing a lower tumour DNA content in the whole plasma cfDNA sample in most cases, which generates large amounts of noise and limits the ctDNA detection sensitivity. A higher sequencing coverage depth might improve the detection sensitivity of ctDNA profiling to a certain extent but would not completely solve the problem due to the limited number of original tumour DNA molecules present in the cfDNA sample. In summary, although our study had various limitations, the non-invasive molecular profiling of resistance mechanisms using ctDNA analysis can define patterns of resistance to trastuzumab therapy. We envision that dynamic ctDNA analysis can be used to detect both pre-existing and emergent resistance mechanisms to determine rational personalised therapies that target tumour heterogeneity and evolution-driven resistance in the near future.
Supplementary file 7
![[gutjnl-2018-316522supp011.jpg]](https://gut.bmj.com/content/gutjnl/68/7/1152/DC11/embed/inline-supplementary-material-11.jpg?download=true)
Supplementary file 12
![[gutjnl-2018-316522supp012.jpg]](https://gut.bmj.com/content/gutjnl/68/7/1152/DC12/embed/inline-supplementary-material-12.jpg?download=true)
References
Footnotes
D-SW, Z-XL and Y-XL contributed equally.
Contributors Conception and design: D-SW, R-HX. Provision of study materials or patients: D-SW, Z-QW, M-ZQ, FW, F-HW, Y-HL, DX, W-HJ, R-HX. Collection and assembly of data: D-SW, Z-XL, Y-XL, HB, XW, Z-LZ, ZL, QZ, C-YH, J-HL, Z-QW, M-ZQ, FW, F-HW, Y-HL, X-NW, DX, W-HJ, YWS. In vitro and in vivo study: Y-XL, Z-LZ, C-YH, J-HL. Data analysis and interpretation: D-SW, Z-XL, HB, XW, ZL, QZ, X-NW, DX, W-HJ, YWS and R-HX. Manuscript writing: All authors. Final approval of manuscript: All authors. Accountable for all aspects of the work: All authors.
Funding (1) The National High Technology Research and Development Program of China (863 Program) (No. 2015AA020103); (2) The Natural Science Foundation of Guangdong Province (No. 2014A030312015), Science and Technology Program of Guangdong (No. 2015B020232008) and the Science and Technology Program of Guangzhou (Nos. 201508020250 and 201604020003); (3) The National Natural Science Foundation of China (Nos. 81602070 and 31501069); (4) The Major Special Project from Guangzhou Health and Medical Collaborative Innovation (No. 15570006); (5) Fundamental Research Funds for the Central Universities (SYSU: 16ykzd06) and (6) The National Key Research and Development Program of China (No. 2017YFC1308900).
Competing interests None declared.
Patient consent Obtained.
Ethics approval The human research ethics committees at Sun Yat-sen University Cancer Center.
Provenance and peer review Not commissioned; externally peer reviewed.