Article Text

Abstract
Background/aims To investigate the prognostic values of putative hepatic stem/progenitor cell (HSC/HPC) biomarkers in patients with hepatocellular carcinoma (HCC).
Methods Fourteen biomarkers related to HSCs/HPCs or tumour angiogenesis were assessed by qRT-PCR and then validated by tissue microarrays (TMAs) in three independent cohorts of patients with HCC undergoing curative resection (n=67, 314 and 73).
Results Most of the biomarkers were found to be overexpressed in patients with recurrent HCC by quantitative reverse transcription–PCR (qRT–PCR). The HSC/HPC biomarkers cytokeratin 19, ATP-binding cassette subfamily G member 2 (ABCG2), CD133, Nestin and CD44, and the markers of angiogenesis microvessel density (MVD, determined by CD34 immunostaining), vascular endothelial growth factor (VEGF) and platelet-derived endothelial cell growth factor (PD-ECGF) were confirmed as significant predictors for overall survival (OS) and/or relapse-free survival (RFS) in TMA analysis. As compared with the low HSC/HPC profile group, patients with a high HSC/HPC profile who had higher VEGF levels (p=0.012) and MVD (p=0.030) in tumours had significantly lower OS and RFS (p<0.0001). Based on Cox regression, a simplified model including CD133, CD44, Nestin and MVD was constructed and confirmed as an independent predictor for OS (p<0.0001) and RFS (p<0.0001), regardless of α-fetoprotein level, tumour stage and recurrence time (p<0.0001 for all).
Conclusion High expression levels of HSC/HPC biomarkers are related to tumour angiogenesis and poor prognosis of HCC. The simplified model based on the HSC/HPC and tumour angiogenesis profile can be used to classify patients with HCC with a high risk of tumour recurrence after surgery.
- Hepatic stem cells
- hepatic progenitor cells
- hepatocellular carcinoma
- molecular pathology
- prognosis
- tumour angiogenesis
Statistics from Altmetric.com
- Hepatic stem cells
- hepatic progenitor cells
- hepatocellular carcinoma
- molecular pathology
- prognosis
- tumour angiogenesis
Introduction
Hepatocellular carcinoma (HCC) is one of the most prevalent tumour types, and both the incidence and mortality rates have increased in recent years.1 There is now abundant evidence that stem cell properties, such as self-renewal, unlimited proliferation and differentiation, are highly relevant to the biology of several human cancers including HCC.2 3 Cancer stem cells (CSCs) have recently been proposed to be the cancer-initiating cells responsible for tumourigenesis and contribute to cancer resistance and metastasis.3 The remarkable similarities between the biology of normal stem cells and CSCs are the basis of a proposal that some cancer stem-like cells (CSLCs) could be derived from human stem cells (HSCs)/human progenitor cells (HPCs).4 Recent studies from our laboratory and others have identified CSLCs as having a tumour-initiating capacity and remarkable chemoresistance in HCC cell lines and specimens.2 5–7 Recently, gene expression profiling of fetal rat hepatoblasts revealed a novel HCC subtype that may have features of HPCs8; however, the clinical significance of this novel subtype remains unclear. It has been reported that cases of HSC-like and HPC-like HCC subtypes had poor prognosis9 10; more studies are still needed to determine the prognostic significance of HSCs/HPCs (or CSLCs) in HCC.
Summary box
Hepatocellular carcinoma (HCC) is one of the most prevalent tumour types. Surgery remains the most effective treatment for HCC, but the high rate of recurrence or metastasis after surgery (50–70% at 5 years) hinders further improvements in HCC survival. Cancer stem cells (CSCs) have recently been proposed to be the cancer-initiating cells responsible for tumourigenesis and contribute to cancer resistance and metastasis. Recently, gene expression profiling of fetal rat hepatoblasts revealed a novel HCC subtype that may have features of hepatic progenitor cells (HPCs); however, the clinical significance of this novel subtype remains unclear. In addition, it has also been reported that cases of hepatic stem cell (HSC)-like and HPC-like HCC subtypes had poor prognosis, but more studies are still needed to determine the prognostic significance of HSCs/HPCs (or CSCs) in HCC. In this study, the expression and clinical significance of putative HSC/HPC (or CSLC) biomarkers and tumour angiogenesis-related markers were investigated by real-time qRT–PCR and immunohistochemistry in three independent cohorts of patients with HCC. We found that a high HSC/HPC profile was related to tumour angiogenesis and indicated early recurrence and poorer prognosis of surgically resected HCC. The simplified model based on the HSC/HPC and tumour angiogenesis profile can be used to classify patients with HCC with a high risk of tumour recurrence after surgery. In the future, treatment targeted to the HSC/HPC or CSLC fraction in HCC and inhibition of tumour angiogenesis simultaneously may comprise a promising antirecurrence strategy for patients with HCC after surgery.
The precise mechanisms of how CSLCs drive tumour growth and metastasis are unclear. It is well known that HCC is a hypervascular tumour that is characterised by neovascularisation, which plays an important role in the growth and progression of HCC.11 12 In our previous study, we found that CSLCs sorted from HCC cell lines expressed more markers of angiogenesis in vitro and formed more microvessels in vivo; the significance of this finding in the clinic needed to be further explored.
In this study, the expression and clinical significances of putative HSC/HPC (or CSLC) biomarkers and tumour angiogenesis-related markers were investigated by real-time quantitative reverse transcription–PCR (qRT–PCR) and immunohistochemistry in three independent cohorts of patients with HCC. We found that a high HSC/HPC profile was related to tumour angiogenesis and indicated high tumour recurrence and poorer prognosis of surgically resected HCC.
Materials and methods
Patients and specimens
Three independent cohorts of patients with HCC were enrolled in this study. Sixty-seven tumour specimens used in qRT–PCR analysis were randomly collected from patients with HCC undergoing curative resection from 2001 to 2003 in our institute (cohort 1, snap-frozen tissues). The other two cohorts (paraffin-embedded tissues) were randomly collected from patients with HCC undergoing curative resection from 1997 to 2000 (cohort 2, n=314) and in 2005 (cohort 3, n=73). The entrance criteria and postsurgical patient surveillance were the same as those we previously described.13 14 Follow-up was terminated on 15 March 2008. The clinicopathological characteristics of patients in the three cohorts are summarised in table 1. Overall survival (OS) was defined as the interval between surgery and death or the last observation taken. The data were censored at the last follow-up period for living patients. Relapse-free survival (RFS) was defined as the interval between the date of surgery and the date of diagnosis of any type of relapse (intrahepatic recurrence and extrahepatic metastasis were defined as the end points for RFS).15 Once evidence of recurrence was confirmed, RFS would be calculated as the time when recurrence was first suspected.16 Tumour recurrence was classed as early recurrence and late recurrence using 2 years as the cut-off.17 18 Regarding the recurrence sites, there were mainly three patterns17: type I was local recurrence in remnant liver with a single or double lesion; type II was a multinodular (≥3) or diffuse pattern consisting of many nodules scattered throughout the remaining liver; and type III was extrahepatic metastasis.
The clinicopathological characteristics of three cohorts of patients with hepatocellular carcinoma
Ethics approval for the use of human subjects was obtained from the research ethics committee of Zhong Shan Hospital, and informed consent was obtained from each patient.
Real-time qRT–PCR analysis
For the real-time qRT–PCR, pure RNA was extracted from frozen tumour specimens, followed by reverse transcription and amplification. Gene expression levels were calculated according to the following equation: 2−△CT [△CT=Ct(target)−Ct(β-actin)]. PCR conditions were as follows: 10 min at 95°C, followed by 40 cycles of 95°C for 10 s and 60°C for 60 s. The details of primers are given in Supplementary table S1.
Tissue microarrays (TMAs) and immunohistochemistry
Cytokeratin 7 (CK7), cytokeratin 19 (CK19), CD44, CD133, epithelial cell adhesion molecule (EPCAM), Nestin, ATP-binding cassette subfamily G member 2 (ABCG2), vascular endothelial growth factor (VEGF), platelet-derived endothelial cell growth factor (PD-ECGF) and CD34 which were significantly related to tumour recurrence in qRT–PCR analysis were further validated by TMAs. In addition, OV6, as the classic biomarker for hepatic progenitor cells,19 was also included (owing to the lack of gene sequence information for humans, OV6 was not included in the qRT–PCR analysis). As anti-CD90 immunostaining was ambiguous using several antibodies available now (antibodies from Biosciences PharMingen, Abcam, Novus and Abgent), CD90 was not included in TMAs analysis.
TMAs were constructed as previously described.13 14 Two core biopsies of 1 mm in diameter were taken from the donor blocks and transferred to the recipient paraffin block at defined array positions. Five different TMA blocks including 314 cases in cohort 2 and 73 cases in cohort 3 were constructed.
The antibodies used in this study are shown in Supplementary table S2. Immunohistochemistry was carried out using a two-step protocol (Novolink Polymer Detection System, Novocastra, Newcastle, UK) as previously described.13 14
Evaluation of immunohistochemical variables
Immunohistochemical staining was assessed by two independent pathologists without knowledge of patient characteristics. Discrepancies were resolved by consensus. Scores were assigned as the percentage of positive staining of the cytosol/membranes in the whole cylinder. A computerised image analysis system was composed of a Hitachi HV-C20A CCD camera (Hitachi, Tokyo, Japan), installed on a Leica DMLA light microscope (Leica Microsystems, Wetzlar, Germany), and attached to a personal computer. Under ×200 magnification, both moderate and strong staining was considered positive, while no or weak staining was treated as negative. Immunoreactivity for each marker was scored semi-quantitatively by evaluating the number of positive tumour cells over the total number of tumour cells. According to tumour microvessel density (MVD; determined by CD34), any stained endothelial cell or endothelial cell cluster that was clearly separated from adjacent microvessels, tumour cells and connective tissue elements was counted as one microvessel.12 20 The mean value of the two scores was considered representative of one tumour. The details of the scoring criteria are shown in Supplementary table S2.
Construction of a weighted RFS predictive score algorithm
We used univariate Cox proportional hazards regression analysis to evaluate the association between recurrence and the expression of each biomarker. A patient's recurrent risk score was derived by the summation of each biomarker's expression level (positive=1, negative=0) multiplied by its corresponding regression coefficient.21 All patients were then divided into two groups (HSCs/HPCshigh and HSCs/HPCslow) by the cut-off value that came from the median of the final risk scores (figure 1A).

Development of the hepatic stem cell (HSC)/hepatic progenitor cell (HPC) predictive model in cohort 2 by immunochemistry analysis. Each column represents an individual patient with the recurrence status. The slope of the red triangle represents the magnitude of the corresponding recurrence scores. The corresponding microvessel density (MVD) of each patient is shown below (A). Comparison of relapse-free survival (B), overall survival (C) and MVD (D) between the HSCs/HPCslow and HSCs/HPCshigh group. ABCG2, ATP-binding cassette subfamily G member 2; CK7, cytokeratin 7; CK19, cytokeratin 19; EPCAM, epithelial cell adhesion molecule.
Statistical analysis
Unsupervised hierarchical clustering analysis was done using the Cluster software (version 3.0) and TreeView software (version 1.0.13).22 Statistical analyses were performed using SPSS 15.0 for windows. Cumulative survival time was calculated by the Kaplan–Meier method and analysed by the log-rank test. Univariate and multivariate analyses were based on the Cox proportional hazards regression model. The correlation significance was analysed by Kendall tau-b rank correlation analysis. Receiver operating characteristic (ROC) curve analysis was used to determine the predictive value of the parameters, and the differences in the area under the curve (AUC) were detected by using Stata 10. The χ2 test, Fisher exact probability and Student t test were used for comparison between groups. A p value <0.05 was considered statistically significant.
Results
The mRNA expression of 14 biomarkers in HCC tissues
Overexpression of CK7, CK19, CD44, CD90, CD133, EPCAM, Nestin, ABCG2, VEGF, PD-ECGF and CD34 mRNA was found in the group of patients with recurrence (p<0.05), while the expression of CK14, CD56 and CD117 was not significant different between patients with (n=29) and without recurrence (n=38) (p>0.05, figure 1A).
Unsupervised hierarchical clustering based on relative expression values of the 11 HPC/HSC biomarkers classified the 67 patients with HCC into two subgroups (cluster A for low and cluster B for high, figure 1B). There were significant differences in OS (p=0.009) and RFS (p<0.0001) between the two subgroups according to Kaplan–Meier analysis (figure 1C). The expression level of VEGF in cluster B was significantly higher than that in cluster A (p=0.031, figure 1D).
Immunohistochemical characteristics of 11 biomarkers
All the biomarkers stained the membrane or cytoplasm of tumour cells and showed a variety of staining patterns, including differences in staining intensity and percentage of positive cells. A duplicate set of spots for each tumour showed a good level of homogeneity for both stained cell percentages and intensities. The staining patterns of the HSC/HPC biomarkers were focal, scattered and diffuse with different staining intensity. In some cases, we found that some biomarkers, such as CD133, CK19, CK7, Nestin and OV6, were localised in small tumour cells, some appeared in strings of cuboidal cells organised into clusters or extensions thereof, and others were located in close proximity to periportal veins, reminiscent of cholangiocytes that form the canal of Hering, which may indicate the sites of progenitor cells (Supplementary figure S1).23 The expression patterns of VEGF and PD-ECGF in tissues were diffuse, with different staining intensity. MVD in HCC tissues ranged from 0 to 667.5/0.785 mm2 (median, 55.5/0.785 mm2). Representative pictures and statistics are shown in figure 2 and table S3.
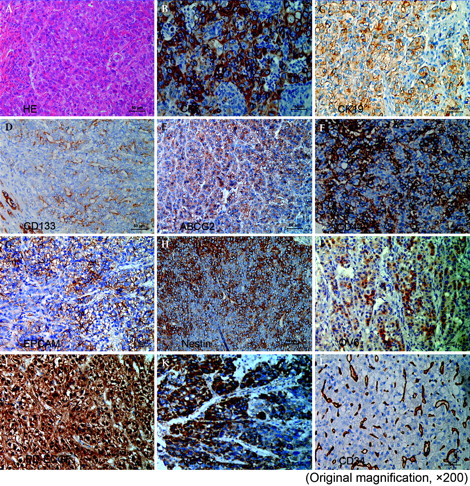
H&E staining (A) and representative positive expression of cytokeratin 7 (CK7) (B), cytokeratin 19 (CK19) (C), CD133 (D), ATP-binding cassette subfamily G member 2 (ABCG2) (E), CD44 (F), epithelial cell adhesion molecule (EPCAM) (G), Nestin (H), OV6 (I), platelet-derived endothelial cell growth factor (PD-ECGF) (J), vascular endothelial growth factor (VEGF) (K) and CD34 (L) by immunochemistry study in tissue microarrays. All the biomarkers stained the membrane or cytoplasm of tumour cells. (Original magnification, ×200 for the whole image.)
Prognostic significance of 11 biomarkers and clinicopathological characteristics
For the whole study population of cohort 2, the 3-, 5-, 7- and 9-year OS and RFS rates were 68.1% and 59.6%, 54.3% and 48.8%, 43.5% and 43.4%, and 39.1% and 39.4%, respectively. On univariate analysis, eight biomarkers (CK19, ABCG2, CD44, Nestin, CD133, VEGF, PD-ECGF and MVD) and eight clinical factors (tumour number, tumour size, vascular invasion, encapsulation, differentiation, TNM stage, serum γ-glutamyl transferase (GGT) level and CLIP (Cancer of the Liver Italian program score)) were all confirmed as prognostic factors for OS and/or RFS, while CK7, EPCAM, OV6 and other clinical indexes (sex, age, hepatitis B surface antigen (HBsAg) and hepatitis C virus (HCV) infection status, Child–Pugh score, liver cirrhosis, alanine aminotransferase (ALT), α-fetoprotein (AFP) and adjuvant TACE (transcatheter arterial chemoembolisation)) had no prognostic significance for OS and RFS (table 2). CD133, CD44, Nestin, MVD, vascular invasion and GGT were independent factors for tumour recurrence according to multivariable Cox proportional hazard regression analyses (table 3).
Univariate analyses of factors associated with survival and recurrence in cohort 2 (n=314)
Multivariate analyses of 11 biomarkers with three clinicopathological characteristics for RFS in cohort 2 (n=314)
The predictive model based on the HSC/HPC profile
The risk score of the HSC/HPC profile predictive model was calculated as follows: (0.212×CK7)+(0.269×CK19)+(0.821×CD44)+(0.610×CD133)+(0.555×Nestin)+(0.402×ABCG2)+(0.305×EPCAM)+(0.271×OV6). The coefficients were calculated by Cox regression, and the gene name represents its expression level (positive=1, negative=0). The median of the final risk scores is 0.821. All patients were divided into the HSCs/HPCshigh (risk score >0.821) or HSCs/HPCslow group (risk score ≤0.821, figure 3A).

(A) The mRNA expression level of 11 putative hepatic stem cell (HSC)/hepatic progenitor cell (HPC) biomarkers and three tumour angiogenesis markers in hepatocellular carcinoma (HCC) tissues between groups with and without recurrence. (B) According to the unsupervised hierarchical cluster, 67 patients with HCC were classified into two groups (cluster A=26, cluster B=41) by the mRNA levels of 11 HPC/HSC biomarkers (the grey areas indicate missing data). (C) Comparison of relapse-free survival (RFS) and overall survival (OS) between cluster A and B. Cluster B had lower RFS and OS compared with cluster A. (D) Comparison of VEGF mRNA level between cluster A and B. ABCG2, ATP-binding cassette subfamily G member 2; CK7, cytokeratin 7; CK14, cytokeratin 14; CK19, cytokeratin 19; EPCAM, epithelial cell adhesion molecule; PD-ECGF, platelet-derived endothelial cell growth factor; VEGF, vascular endothelial growth factor.
The 5-year OS and RFS rates in the HSCs/HPCslow group were significantly higher than those in the HSCs/HPCshigh group (64.2% and 60.9% vs 43.7% and 35.0%, p<0.0001 and p<0.0001, figure 3A–C and table 3). In multivariate analyses, the HSC/HPC predictive model was an independent predictor for both RFS and OS (p<0.0001 and p<0.0001, table S4).
The correlation of the HSC/HPC profile predictive model with tumour angiogenesis and other clinicopathological features
Tumours in the HSCs/HPCshigh group expressed higher VEGF (69.5% vs 55.8%, p=0.012, table S5) and had higher MVD (110.3±118.4 vs 78.0±89.2, p=0.007, figure 3A,D, table S5) than those in the HSCs/HPCslow group. There was no significant difference in other clinicopathological features between the HSCs/HPCshigh and HSCs/HPCslow groups (table S5).
Constructing the simplified predictive model based on the HSC/HPC profile and tumour angiogenesis markers
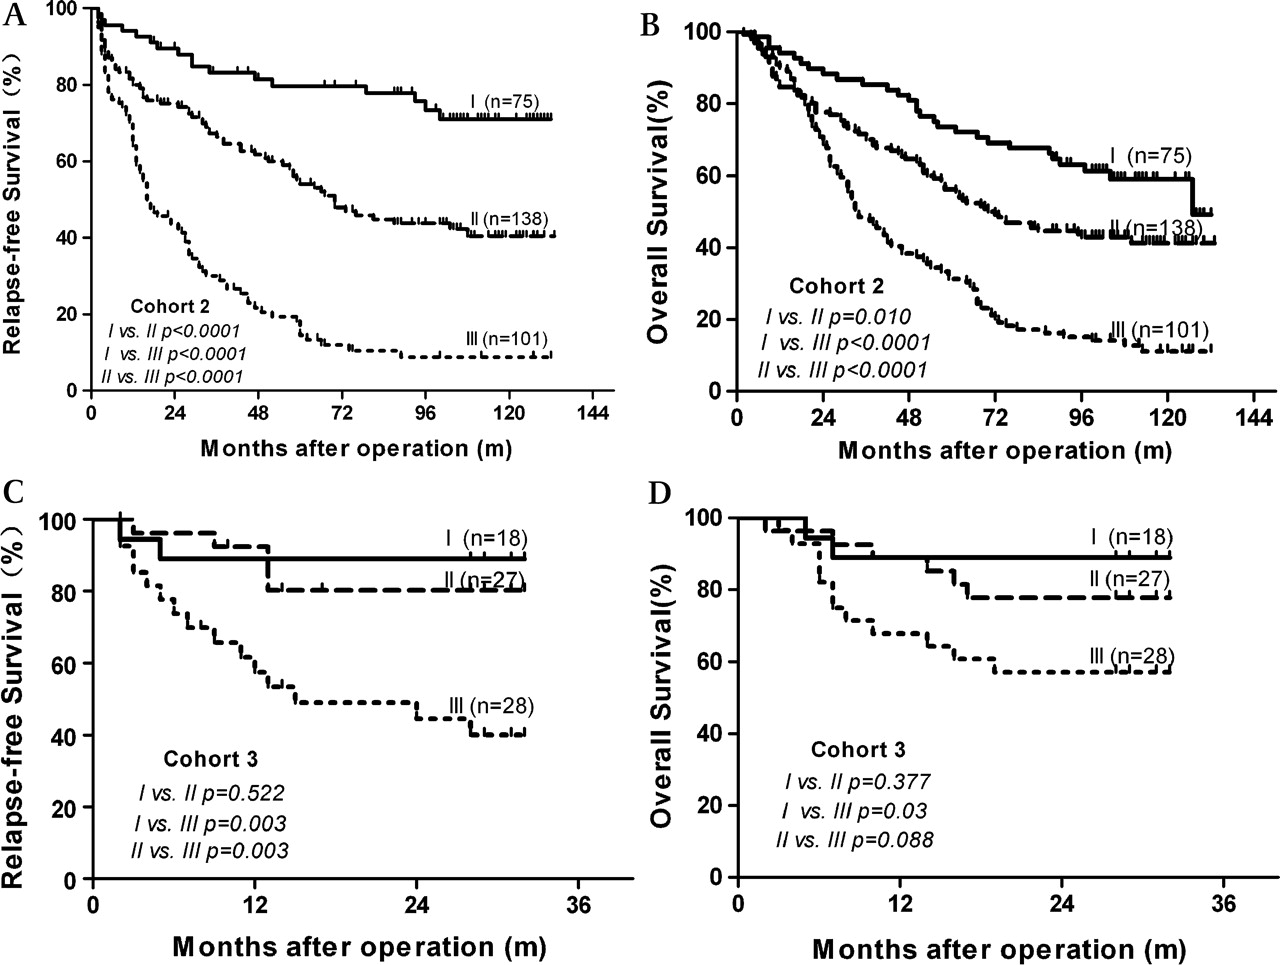
Since HSC/HPC and tumour angiogenesis play important roles in HCC recurrence and have an intimate relationship according to our results, it is reasonable to take these two aspects into consideration together. To improve their use in clinical practice, three HSC/HPC biomarkers (CD133, CD44 and Nestin) and MVD (a tumour angiogenesis marker), which were independent predictors of RFS in multivariate analyses, were employed to build a simplified predictive model: HSCs/HPCshi was assigned if ≥1 of the three HSC/HPC biomarkers were positive; HSCs/HPCslo was assigned if all the three HSC/HPC biomarkers were negative. MVDhi and MVDlo were divided by the median of the MVD value (55.5/0.785 mm2), and then all patients were divided into three groups, I (low risk group, n=75), HSCs/HPCslo/MVDlo; II (moderate risk group, n=138), HSCs/HPCshi/MVDlo or HSCs/HPCslo/MVDhi; III (high risk group, n=101), HSCs/HPCshi/MVDhi. There were significant differences in OS and RFS between each group (p<0.001, table 3 and figure 4A,B). The 5-year OS and RFS rates were 75.8% and 81.6%, respectively, for the low risk group, compared with 58.6% and 55.9% for the moderate risk group and 32.7% and 14.5% for the high risk group. In multivariable analysis, the simplified model was also confirmed as an independent predictor of RFS and OS (table 4).

Kaplan–Meier analysis of relapse-free survival and overall survival for the simplified model in cohort 2 of 314 cases (A, B) and cohort 3 of 73 cases (C, D). (I, low risk group; II, moderate risk group; III, high risk group). The predictive value of the simplified model existed in both cohort 2 and cohort 3.
Multivariate analyses of the simplified model with clinicopathological characteristics in cohort 2 (n=314) and cohort 3 (n=73)
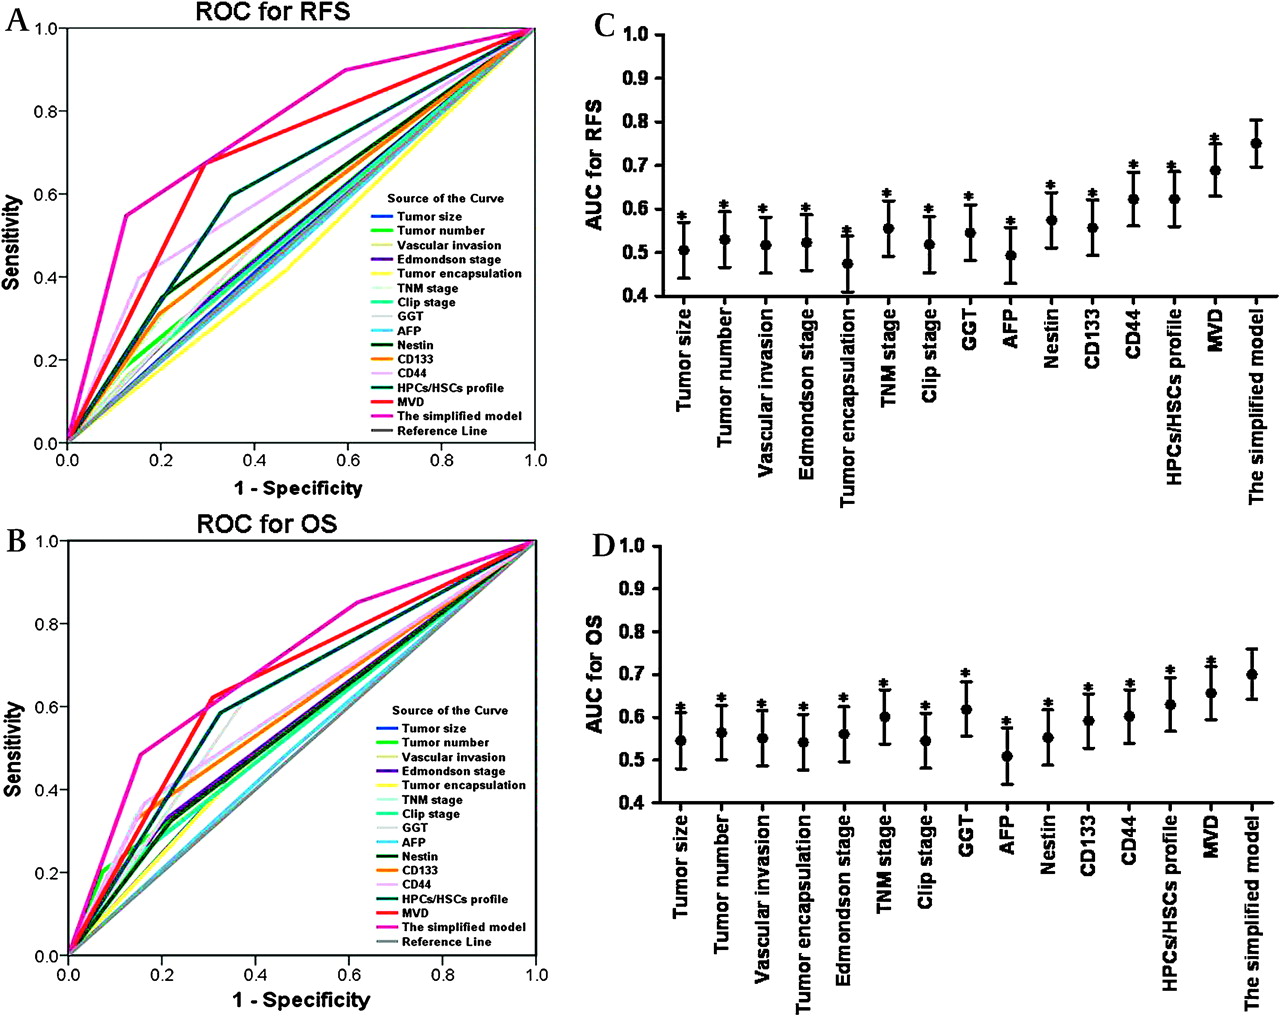
When stratified by AFP level or TNM stage, we found that the simplified model can be a good predictor of RFS and OS, regardless of AFP level and tumour stage (p<0.0001 for all, figure S2C–F). According to time to recurrence, we found that the predictive significance of the simplified model existed in both the early recurrence (≤24 months) and later recurrence group (>24 months) (figure S2A, B). The patients in the high risk group were prone to have earlier recurrence (56/95 vs 29/74, p=0.034, figure S3A) and type II or III recurrence (32/50 vs 53/119, p=0.05, figure S3B) compared with the patients in the moderate risk group. The patients in the low risk group had a significantly lower recurrence rate compared with the patients in the moderate and high risk groups (22.7% vs 48.6% vs 84.2%, p<0.001). Compared with the single biomarkers, the predictive power of the simplified model was higher than CD133, CD44, Nestin and MVD (p<0.05) revealed by the ROC analysis. In addition, the predictive power of the simplified model was higher than other indices (tumour size, number, differentiation, encapsulation, vascular invasion, TNM stage, CLIP score, GGT and AFP) (p<0.05, figure 5A–D and table S6).
The predictive ability of the simplified model compared with single markers and other clinical prognostic parameters by receiver operating characteristic (ROC) curves (A for relapse-free survival (RFS), B for overall survival (OS)). The areas under the curve (AUCs) with 95% CI for OS and RFS are shown in C and D (*p<0.05, compared with the simplified model). The details for AUC and 95% CI are also shown in Table S6. AFP, α-fetoprotein; Clip, Cancer of the Liver Italian program score; GGT, γ-glutamyl transferase; HPCs, hepatic progenitor cells; HSCs, hepatic stem cells; MVD, microvessel density; TNM, tumour–node–metastasis.
Validation of the simplified model
We validated the predictive value of the simplified model in another independent cohort of 73 patients with HCC. The results were similar to those in cohort 2. Patients with HCC classified as high risk had a shorter OS and RFS than those in the moderate risk and low risk group (p<0.05, table S7, figure 4C,D). In multivariate Cox proportional hazards analyses, the simplified model was still an independent predictor of OS and RFS in cohort 3 (table 4). The p values for RFS in cohort 3 were 0.057 and 0.061 in the AFP-negative and TNM I group, respectively, which may be due mainly to the small sample size and limited follow-up time (figure S2G–J).
Discussion
Recent research using gene expression profiles indicated that some HCCs may originate from HPC/HSC and have poor prognosis.8 9 The CSCs theory suggests that tumour growth is sustained by a small proportion of cells that exhibit stem cell properties, called CSCs.3 The stem cell-like phenotype of CSCs and their limited number within the bulk of the tumour are believed to account for their ability to escape conventional treatments, thus leading to disease relapse and distant metastases even when the primary lesion is eradicated.3 4 Using biomarkers from normal stem cells or progenitor cells, the existence of CSLCs has been identified in the context of leukaemia, breast cancer, brain tumour, prostate, gastric, lung and colon cancer and HCC.3 5–7 Although most of these studies are able to show cancers initiated by certain populations enriched for CSLCs, homogeneity has not been achieved. The origin of the CSLCs remains elusive. In fact, data reveal that CSLCs can originate from either stem cells or progenitors.3 4 The liver CSLCs may be the most extreme example where side population (SP) cells,5 7 CD133+ cells6 and CD90+ cells24 in cases of HCC harboured similar CSLC properties but seldom cross-expressed the selecting biomarkers. In our previous study, we found that CSLCs sorted from different HCC cell lines and specimens showed great heterogeneity in genome profiles and cell surface biomarkers. These observations imply that liver CSLCs may arise from cells at various stages of differentiation in the hepatocyte lineage, of which the HSC/HPC population is a logical resource because of the inherent abilities for self-renewal and multilineage differentiation. In this study, the expression of putative HSC/HPC biomarkers was investigated by qRT–PCR, and then validated in two different cohorts of patients with HCC by TMA analysis. The biomarkers employed in this study were carefully selected according to our previous studies and other reports. CD133,6 ABCG2,25 OV6,26 CK710 and CK1910 were reported as HPC biomarkers previously, and CD133 was used to identify CSLCs in several types of tumours, including HCC.6 CD44, as a biomarker of HSC,27 has been reported as a target to eradicate CSLCs in HCC24 and has also been linked to the invasion and metastatic potential of HCC.28 29 Nestin was identified as a CSLC biomarker in breast30 and brain cancers31 and was also highly expressed in HSCs27; it has been reported to possess prognostic significance in brain tumour,32 melanoma33 and colorectal cancer.34 EPCAM, as a progenitor cell marker, was correlated with poor prognosis of HCC in a previous report.9 Recently, CD90 was reported as a key marker for the selection of CSLCs.24 Although CD90 mRNA showed significant differences between patients with and without recurrence, the lack of a suitable antibody for use in immunohistochemical analysis for paraffin-embedded tissues confined its further validation in TMAs.
In this study, HSC/HPC biomarkers are expressed heterogeneously in the whole population; the positive rate of a single biomarker was commonly <30%. No patient expressed all the HSC/HPC biomarkers and only 56/314 (17.8%) patients expressed more than three markers simultaneously. As a result, it is reasonable to assume that employing a set of related biomarkers instead of a single marker will reinforce both the sensitivity and specificity of the predictive model. Considering the heterogeneous expression of these biomarkers in HCC tissues, we set different criteria to determine positive or negative immunohistochemical staining according to previous studies.
In this study, most of the biomarkers were found to be significant predictors of OS and RFS. Patients with HCC with a high HSC/HPC profile were more prone to experience early tumour recurrence and had a very poor prognosis. We suppose that high expression levels of HSC/HPC biomarkers may indicate the abundant CSLCs in primary tumours that could be the key resources for tumour metastasis and recurrence. It was also confirmed in our previous study that the proportion of SP cells, the liver CSLCs,7 sorted from different HCC cell lines was positively related to the metastatic potential of their parent cell lines.5 Interestingly, in this study, we found that a high HSC/HPC profile was significantly related to high expression levels of VEGF and high MVD values revealed by both qRT–PCR and TMA analysis. As tumour angiogenesis is a prerequisite for tumour growth and metastasis, neovascularisation provides not only the route for nutrient supply to the tumour but also the conduit for tumour cells to be shed into the circulation. Our findings indicated that cell subpopulations with stem cell properties may contribute to tumour angiogenesis through an induction of VEGF expression or other angiogenesis agents, which was also consistent with the findings of a previous report.35 In addition, recent findings suggested that tumourigenic stem/progenitor cells and angiogenesis can positively impact on one another to promote both tumour development and maintenance.31 35 Our data revealed that patients with HCC with a high HSC/HPC profile and high MVD values simultaneously had the most dismal outcome. According to the hypothesis of “seed and soil”,36 a high MVD or so-called “vascular niche”31 may also indicate a suitable environment for the growth of tumour seeds.
Several molecular classifications of HCC have been reported based on genetic profiles.8 37 38 However, microarrays based on gene expression levels used to predict patient outcome or define tumour subtypes are not economical or efficient, and generally require specialised technologies. Immunohistochemical studies with fast, convenient and economical features can be done with fewer markers and appear to be suitable for application. Taking the effect of HSCs/HPCs and tumour angiogenesis together, and also the use in clinical practice, we constructed a simplified predictive model using CD133, CD44, Nestin and MVD, which were independent predictors of RFS in multivariable analysis with clinicopathological characteristics. The ROC analysis indicated that the predictive ability of the simplified model was more robust than that of a single biomarker and the other clinicopathological indices. Owing to the high heterogeneity of HCC, the predictive range of a single biomarker is normally limited to a very narrow subpopulation (the positive rates of CD133, CD44 and Nestin are all <30%), while using the combination of several biomarkers significantly increases the predictive range and power. In this study, patients with HCC from two independent cohorts were classified into three groups with a different recurrence risk by using the simplified model.
AFP is the most widely used tumour marker in the diagnosis and management of HCC, and remains the best marker to supervise recurrence and metastasis in AFP-positive patients with HCC after surgery.39 40 Nevertheless, the prognostic value of AFP is still controversial.39 In this study, AFP was a predictor of OS and RFS in cohort 3, while it was not in cohorts 1 and 2, which may be due to the difference in patient selection. Up to now, there is still a lack of an deal factor to demonstrate its prognostic value in the 30–40% of patients with HCC with normal serum AFP.29 40 The simplified model was very valuable in predicting the prognosis of AFP-negative patients with HCC, and also patients with early stage HCC, which were usually very difficult to predict by conventional clinical indices.40 It has been well accepted that early and late tumour recurrences are linked to different predictive factors.17 When tumour recurrence was classified as early and late using 2 years as the cut-off, we found that the simplified model showed predictive value in both groups. The patients in the high risk group were more prone to have early recurrence and type II or III recurrence, which may mainly be caused by the highly tumourigenic cells dissociated from the primary tumour before or during surgery.17 These findings imply that we should pay great attention to the patients classified as high and moderate risk. In our experience, these patients are followed for tumour recurrence using ultrasonography and AFP every month for at least 1 year after surgery, and CT and/or MRI scans are taken every 6 months for 1 year, and yearly thereafter. Personal adjuvant therapy may be taken as early as possible after surgery, especially for the high risk patients. Although TACE was considered as one of the main adjuvant therapies for patients with HCC after surgery, our data showed that adjuvant TACE had no benefit for the patients with HCC in the high and moderate risk groups (figure S4). This result was in accordance with the theory that HSCs/HPCs or CSLCs were prone to have resistance to chemotherapeutic drugs.3 More effective adjuvant therapies other than TACE need to be explored in the future.
However, most patients with HCC in China had a hepatitis B virus (HBV) background (in our series, this percentage was 83.5%), which was different from the USA, Europe and Japan.41 As a result, the prognostic significance of HSC/HPC biomarkers and the predictive model need further validation in patients with HCC from those areas. In addition, the findings were retrospective results which were confined to patients with HCC undergoing curative resection; larger population prospective studies are still needed to validate the usefulness of this system further.
To our knowledge, this is the first report to demonstrate the prognostic value of HSC/HPC biomarkers in large cohorts of patients with HCC. In the future, treatment targeted to the HSC/HPC or CSLC fraction in HCC and simultaneous inhibition of tumour angiogenesis may comprise a promising antirecurrence strategy for patients with HCC after surgery.
References
Supplementary materials
Web only appendix
Files in this Data Supplement:
Footnotes
Funding This study was supported in part by grants from the National Natural Science Foundation of China (no. 30873039), the National Key Sci-Tech Special Project of China (no. 2008ZX10002-022), Shanghai Science and Technology Development Funds (no. 07SP07003, 10QH1400500 and no. 07JC14010) and the National High Technology Research and Development Program of China (863 Program, no. 2007AA02Z479).
Competing interests None.
Ethics approval Ethics approval for the use of human subjects was obtained from the research ethics committee of Zhong Shan Hospital, and informed consent was obtained from each patient.
Provenance and peer review Not commissioned; externally peer reviewed.