Article Text

Abstract
Background The degree of immune infiltration in tumors, especially CD8+ T cells, greatly impacts patient disease course and response to interventional immunotherapy. Enhancement of tumor infiltrating lymphocyte (TIL) is a critical element of efficacious therapy and one that may be achieved via administration of agents that promote tumor vascular normalization (VN) and/or induce the development of tertiary lymphoid structures (TLS) within the tumor microenvironment (TME).
Methods Low-dose stimulator of interferon genes (STING) agonist ADU S-100 (5 µg/mouse) was delivered intratumorally to established subcutaneous B16.F10 melanomas on days 10, 14 and 17 post-tumor inoculation. Treated and control tumors were isolated at various time points to assess transcriptional changes associated with VN and TLS formation via quantitative PCR (qPCR), with corollary immune cell composition changes in isolated tissues determined using flow cytometry and immunofluorescence microscopy. In vitro assays were performed on CD11c+ BMDCs treated with 2.5 µg/mL ADU S-100 or CD11c+ DCs isolated from tumor digests and associated transcriptional changes analyzed via qPCR or profiled using DNA microarrays. For T cell repertoireβ-CDR3 analyses, T cell CDR3 was sequenced from gDNA isolated from splenocytes and enzymatically digested tumors.
Results We report that activation of STING within the TME leads to slowed melanoma growth in association with increased production of antiangiogenic factors including Tnfsf15 (Vegi) and Cxcl10, and TLS-inducing factors including Ccl19, Ccl21, Lta, Ltb and Light. Therapeutic responses resulting from intratumoral STING activation were characterized by improved VN, enhanced tumor infiltration by CD8+ T cells and CD11c+ DCs and local TLS neogenesis, all of which were dependent on host expression of STING. Consistent with a central role for DC in TLS formation, ADU S-100-activated mCD11c+ DCs also exhibited upregulated expression of TLS promoting factors including lymphotoxin-α (LTA), interleukin (IL)-36, inflammatory chemokines and type I interferons in vitro and in vivo. TLS formation in ADU S-100-treated mice was associated with the development of a highly oligoclonal TIL repertoire enriched in expanded T cell clonotypes unique to the TME and not detected in the periphery.
Conclusions Our data support the premise that i.t. delivery of low-dose STING agonist promotes VN and a proinflammatory TME supportive of TLS formation, enrichment in the TIL repertoire and tumor growth control.
- CD8-Positive T-Lymphocytes
- dendritic cells
- immunohistochemistry
- immunotherapy
- melanoma
This is an open access article distributed in accordance with the Creative Commons Attribution Non Commercial (CC BY-NC 4.0) license, which permits others to distribute, remix, adapt, build upon this work non-commercially, and license their derivative works on different terms, provided the original work is properly cited, appropriate credit is given, any changes made indicated, and the use is non-commercial. See http://creativecommons.org/licenses/by-nc/4.0/.
Statistics from Altmetric.com
Background
Melanoma remains a significant health concern, representing the fifth most commonly diagnosed form of cancer in the USA in 2020.1 Many melanoma patients lack discernable tumor infiltrating lymphocytes (TIL), a harbinger of poor clinical prognosis and responsiveness to first-line immune checkpoint blockade.2 This places a premium on development of interventional regimens that effectively promote a proinflammatory tumor microenvironment (TME), which may then be combined with immune reinvigorating therapies such as checkpoint blockade to optimize objective clinical response rates among advanced stage melanoma patients with primary/acquired resistance to first-line intervention.
In this context, we and others have actively studied therapeutic vascular normalization (VN) as an interventional strategy to promote enhanced immune infiltration and a proinflammatory TME.3 4 In the VN paradigm originally proposed by Jain,5 6 provision of antiangiogenic agents at low-moderate (sub-MTD) doses results in improved tumor vascular integrity and perfusion, leading to tissue normoxia, increased stromal production of pro-inflammatory chemokines and augmentation in levels of TIL.6 7 One class of agents that concomitantly activates robust inflammatory immune responses includes agonists of STING, a cytosolic double-stranded DNA (dsDNA) sensor, which have demonstrated therapeutic potential in early phase clinical trials.8 9 However, the mechanisms underlying effective treatment of cancer with STING agonists remain only partially resolved.
We now report that intralesional treatment of melanoma-bearing mice with STING agonist ADU S-100 promotes local production of antiangiogenic factors and normalization of tumor associated vasculature. Additionally, local STING activation also upregulates the production of tertiary lymphoid structures (TLS)-inducing chemokines/cytokines within the TME and the maturation of dendritic cells (DCs) supporting increased proinflammatory immune infiltration and formation of non-classical TLS in association with controlled tumor growth. These therapeutic effects are strictly dependent on host, but not tumor cell, expression of STING. Furthermore, the STING therapy-associated TIL T cell repertoire (TCR) repertoire demonstrates greater clonality and population richness vs TIL in control mice. This includes an expanded cohort of unique T cell clonotypes found only in the TME, supporting the concept of local cross-priming of T cells within the therapeutic TME.
Together, these findings further our translational understanding of STING agonist-based treatment regimens in the cancer setting and support a paradigm for VN and local TLS formation in the operational effectiveness of this class of immunotherapeutic agent.
Methods
Animal models and cell culture
Female C57BL/6J (Cat. No. 000664), STINGKO goldenticket (Cat. No. 017537) and BALB/C (Cat. No. 000651) mice aged between 6 and 8 weeks were purchased from Jackson Laboratory (Bar Harbor, Maine, USA). The B16.F10 (CRL-6475) and RENCA (CRL-2947) murine tumor cell lines were purchased from ATCC (Manassas, Virginia, USA), maintained and passaged under sterile conditions. B16.F10 and RENCA cells were cultured in Roswell Park Memorial Institute (RPMI) media (Cat. No. 21 870–076, Gibco) supplemented with 10% heat-inactivated fetal bovine serum (Cat. No. F442, Sigma-Aldrich, St. Louis, Missouri, USA), 100 µg/mL streptomycin, 100 U/mL penicillin (Cat. No. 15 140–22, Gibco) and 10 mmol/L L-glutamine (Cat. No. 25 030–081, Gibco) in a humidified incubator under 5% CO2 tension and 37°C. BPR20 (BRAFV600EPTEN-/-) melanoma cells were derived from the BP melanoma cell line10 (the kind gift of Jennifer Wargo, MD Anderson Cancer Center) under in vitro selection with 20 µM Dabrafenib in complete DMEM culture media. All cell lines were tested for, and confirmed to be free of, mycoplasma contamination.
Animal experiments
Mice received subcutaneous (s.c.) injections of 105 syngeneic B16.F10, BPR20 or RENCA tumor cells in 100 µL of PBS on the right flank (or in both flanks for bilateral model experiments). Ten days after inoculation, tumors were measured, and mice were randomized to obtain cohorts with comparable mean tumor sizes. Mice were then injected intratumorally (i.t.) (right flank) with sterile phosphate-buffered saline (PBS) or 5 µg of endotoxin free ADU S-100 (Cat.No: HY-12885B, MedChemExpress) resuspended in sterile PBS. Repeat injections were administered on days 14 and 17 post-tumor inoculation. Tumor growth was monitored daily and measured (two dimensions; long axis and short axis) every 2 days using a Vernier caliper. Tumor growth is reported as tumor area (in mm2 ±SD) based on the product of orthogonal measurements of the long and short axes of the palpable tumor. For studies characterizing the tumor vasculature, mice received an i.v. injection of 200 µL of 1 mg/mL of Alexa Fluor 488-conjugated Lycopersicon Esculentum (a.k.a. lectin) (Cat. No. DL-1174–1, Vector Laboratories) diluted in sterile PBS just prior to euthanasia. All mice were monitored, treated and euthanized according to Institutional Animal Care and Use Committee approved protocols and the University of Pittsburgh’s Division of Laboratory Animal Resources recommended guidelines.
Bone marrow harvest and DC culture
Bone marrow (BM) isolated from C57BL/6J mice was treated with ACK lysis buffer to remove contaminating red blood cells (RBCs). Purified BM cells were plated in a 6-well plate at a density of 2×10⁶ cells/5 mL of DC culture media (complete RPMI +rmGM-CSF (1000 U/mL, Peprotech)+rmIL-4 (1000 U/mL, Peprotech)) in a humidified incubator at 37°C and 5% CO2. BM culture was supplemented with fresh DC culture media on day 3, with cells harvested by scraping on day 5. CD11c+ DC were isolated using STEMCELL magnetic CD11c+ negative selection kits per the manufacturer’s protocol. For in vitro experiments, 2.5 µg/mL of ADU S-100 was added to CD11c+ DCs in culture for 16 hours at 37°C. For TBK1 inhibition experiments, CD11c+ DCs were pretreated with 150 µg/mL Amlexanox (InvivoGen) for 1 hour at 37°C, prior to addition of 2.5 µg/mL of ADU S-100.
Western blotting
Cells for western blotting were collected and washed twice using cold PBS. Cell pellets were lysed using a lysis buffer containing protease inhibitor cOmplete Mini (Cat. No. 11836170001, Roche) and phosphatase inhibitor, phosSTOP (Cat. No. 4906837001, Roche) and incubated at 4°C for 30 min. Protein containing supernatants were isolated following high-speed centrifugation at 4°C. Purified proteins were boiled and separated on SDS PAGE gels in reducing conditions. Post separation, the proteins were blotted on to PVDF membranes, blocked using 5% non-fat dry milk in PBS +0.1% Tween-20 (TBS) or 5% BSA solution in TBS for 1 hour at RT. Appropriate primary antibodies (listed in online supplemental table S1) in 2% non-fat dry milk (NFDM) in TBS or in 2% BSA in TBS were incubated for 16–18 hours at 4°C. Appropriate horseradish peroxidase (HRP)-conjugated secondary antibodies (1:10 000 in 2% NFDM) were incubated for 1 hour at room temperature. SuperSignal West Femto (Cat. No: 34095, Thermo) chemiluminescence substrate was used to visualize resulting protein bands.
Supplemental material
Tumor tissue processing
Tumors were resected on the day of euthanasia and were digested using a cocktail of enzymes [RPMI containing DNAse I (Sigma D5025 @ 20 U/mL), Collagenase IA (Sigma C5894 @ 0.5 mg/mL), Collagenase II (C1764 @ 0.5 mg/mL) and Collagenase IV (Sigma C1889 @ 0.5 mg/mL)] for 30 min at 37°C on a shaker. Tumor digests were then dissociated through a 70 µm filter and washed twice using PBS. Tumor-derived single cell suspensions were then analyzed.
Flow cytometry
Purified cell populations and tumor digests were washed twice with PBS prior to flow staining. Tumor digests were blocked with FcR block (BD Pharmingen, Cat. No: 553142) prior to staining for flow cytometry. Cells were then incubated with appropriate primary antibodies in FACS buffer for 30 min at 4°C prior to flow cytometry analysis performed using either BD LSR II or BD Fortessa machines within the Unified Flow Cytometry Core at the University of Pittsburgh. Flow cytometry data were acquired using BD FACSDiva software and analyzed using FlowJo V.10.
Immunofluorescence microscopy
Tumor tissues were processed and stained using protocols published by the University of Pittsburgh’s Center for Biological Imaging (https://www.cbi.pitt.edu). Probes used are listed in (online supplemental table S1. Fluorescence images were acquired using Olympus Provis or Nikon 90i microscopes. Quantitation of fluorescent probes were performed on the Nikon Elements AR or ImageJ software. Postacquisition statistical analyzes on fluorescent images were performed on GraphPad Prism V.8.
Real-time PCR
mRNA from CD11c+ DCs or enzymatically dissociated tumors was isolated using the RNEasy Micro Plus Kit (Cat. No. 74034, Qiagen) according to manufacturer’s protocol. Isolated mRNA was converted to cDNA using a high-capacity RNA to cDNA kit (Cat. No. 4387406, Applied Biosystems). Quantitative PCR (qPCR) was performed on cDNA using the Fast SYBR Green Master Mix (Cat. No. 4385612, Applied Biosystems). PCR reactions were quantitated on the StepOnePlus thermocycler (Applied Biosystems). Gene expression was normalized to mHPRT1 (Cat. No. QT00166768, Qiagen) and fold changes were calculated using 2-ΔΔCt method. Primer sequences are listed in online supplemental table S2.
Tumor apoptosis assay
Cultured B16.F10 cells were treated with PBS or 2.5 µg/mL of ADU S-100 for 30 hours or 0.5 µM staurosporine (Cat. No: S1421, Selleckchem) for 5 hour. Following incubation with respective drugs, tumor cells were harvested by trypsinization. Induction of apoptosis was quantified using flow cytometric analysis of Annexin V (Cat. No: V13246, Invitrogen) and LIVE/DEAD Fixable Aqua staining (Cat. No: L34957, Invitrogen).
TCRβ-CDR3 sequencing
gDNA was isolated from day 18 tumor digests (processed as detailed above) and spleen digests (mechanically disrupted, ACK lysed). Following gDNA isolation, TCRβ-CDR3 gene regions were amplified using proprietary primers designed by Adaptive Biotechnologies (Seattle, WA). Amplified TCRβ-CDR3 regions were then sequenced at a survey depth using the Illumina HiSeq platform. gDNA isolation, CDR3 library preparation and CDR3 sequencing were all performed on a fee-per-service basis by Adaptive Biotechnologies. Analysis of TCR sequencing data was performed using the ImmunoSEQ Analyzer, a proprietary TCRseq analysis software created by Adaptive Biotechnologies.
Statistical tests
Comparisons between two groups were performed using two-tailed Student’s t-tests while comparisons between multiple groups were performed using (one-way or two-way) analysis of variance with Tukey’s post hoc analysis. P values <0.05 were considered significant. Prism V.8 (GraphPad Software, La Jolla, California, USA) was used to generate graphs and perform statistical tests.
Results
STING agonist ADU S-100 slows tumor growth, promotes VN and enhances immune cell infiltration into the TME
Previous reports have highlighted the immune-independent tumor control and dose-dependent toxicities of STING agonist-based therapy.11–13 To mitigate such adverse effects, we evaluated the anti-tumor potential of STING activation in the TME by administering low doses of the small-molecule STING agonist ADU S-100 i.t. in transplantable s.c. murine B16.F10 melanoma models. In order to avoid vasoablation and T cell apoptosis observed with high, near-MTD doses of STING agonists,14–16 and based on preliminary findings for tumor ulceration necessitating euthanasia at doses >5 µg/tumor (data not shown), we adopted the use of a low dose (5 µg/tumor; ie, ~100-fold lower than conventional dosing) of ADU S-100 for i.t. injections administered on days 10, 14 and 17 post-tumor inoculation (figure 1A). Under these treatment conditions, ADU S-100 injections resulted in slowed tumor growth (figure 1B) and prolonged survival (figure 1C) vs mice treated with PBS. Similar anti-tumor effects for this interventional therapy were observed in two unrelated s.c. tumor models; BPR20 (BRAFV600EPTEN-/-) melanoma in C57BL/6 hosts (online supplemental figure S1a) and RENCA renal carcinoma in BALB/c hosts (online supplemental figure S1b).

Intratumoral STING activation slows melanoma growth in mice. (A) Schematic depiction of our in vivo experimental design. C57BL/6J mice bearing subcutaneous B16.F10 tumors received three intratumoral injections of 5 µg ADU S-100 over the span of a week. (n=5/group) (B) representative tumor growth curves from cohorts of B16.F10 melanoma showing significantly slower tumor growth kinetics when mice were treated with ADU S-100 intratumorally. Tumor measurements represented as total tumor area (calculated as small axis X large axis) ****p < 0.0001, two-way ANOVA (C). Representative Kaplan-Meier survival plot depicting improved survival in mice treated with ADU S-100 vs control mice. *p = 0.005, Mantel-Cox log RANK test. (D) Post-treatment tumor digests obtained on day 18 show transcriptional signatures associated with vascular normalization such as with increased anti-angiogenic factors (Tnfsf15/Vegi, Cxcl10) and decreased tissue hypoxia (using Hif1a and Hif2a as biomarkers) in ADU S-100 treated tumors. *p < 0.05; **p < 0.002. (E) Immunofluorescence staining and image quantitation showing reduced expression of hypoxia-responsive cancer stem cell markers CD133 and JARID1B in ADU S-100-treated B16.F10. *p< 0.05; ***p < 0.0002. Data are representative of three independent experiments. ANOVA, analysis of variance; i.t, intratumorally.
Since the first-generation murine STING agonist, DMXAA, was developed as an anti-angiogenic agent,13 we sought to determine whether delivery of low-dose ADU S-100 would support VN via a paradigm originally proposed by Jain et al,6 leading to increased production of antiangiogenic factors within the treated TME. To test this hypothesis, RNA was isolated from PBS control-treated or ADU S-100-treated tumors and analyzed by qPCR for expression of antiangiogenic factors.17 18 Compared with control tumors, ADU S-100 treated tumors coordinately expressed: (1) significantly elevated levels of transcripts encoding anti-angiogenic factors Tnfsf15 (Vegi) and Cxcl10, and (2) significantly reduced expression of hypoxia-associated transcripts Hif1a and Hif2a (figure 1D) and hypoxia-responsive cancer stem cell markers CD133 and Jarid1b19 (figure 1E), which together supported possible VN in the TME on-treatment with STING agonist.
We next performed immunofluorescence microscopy (IFM) studies on isolated tumor sections from control versus ADU S-100-treated mice to discern therapy impact on indices of VN including vessel perfusion and tight pericyte coverage of blood vessels. Analysis of tumor specimens isolated from mice after i.v. injection of a fluorescently labeled vascular binding lectin revealed that blood vessels in tumors from mice treated with ADU S-100 displayed improved perfusion versus tumors isolated from PBS-treated control mice (figure 2A,B). Furthermore, IFM analyzes confirmed improved PDGFRβ+ pericyte coverage of CD31+ vascular endothelial cells (VECs) in ADU S-100 treated versus control B16 tumors (figure 2C,D, online supplemental figure S2) with the tight approximation of the CD31- and PDGFRβ-associated fluorescence signals on the abluminal vascular surface, consistent with the ability of low-dose ADU S-100 to promote therapeutic VN.6 20 We also observed that CD31+ VECs in tumors treated with ADU S-100 exhibited increased expression of vascular cell adhesion molecule-1 (VCAM1), an endothelial cell marker known to be upregulated in response to improved oxygenation21 and inflammation,22 23 and which facilitates tissue recruitment of circulating VLA-4+ T effector cells (figure 2G,H).
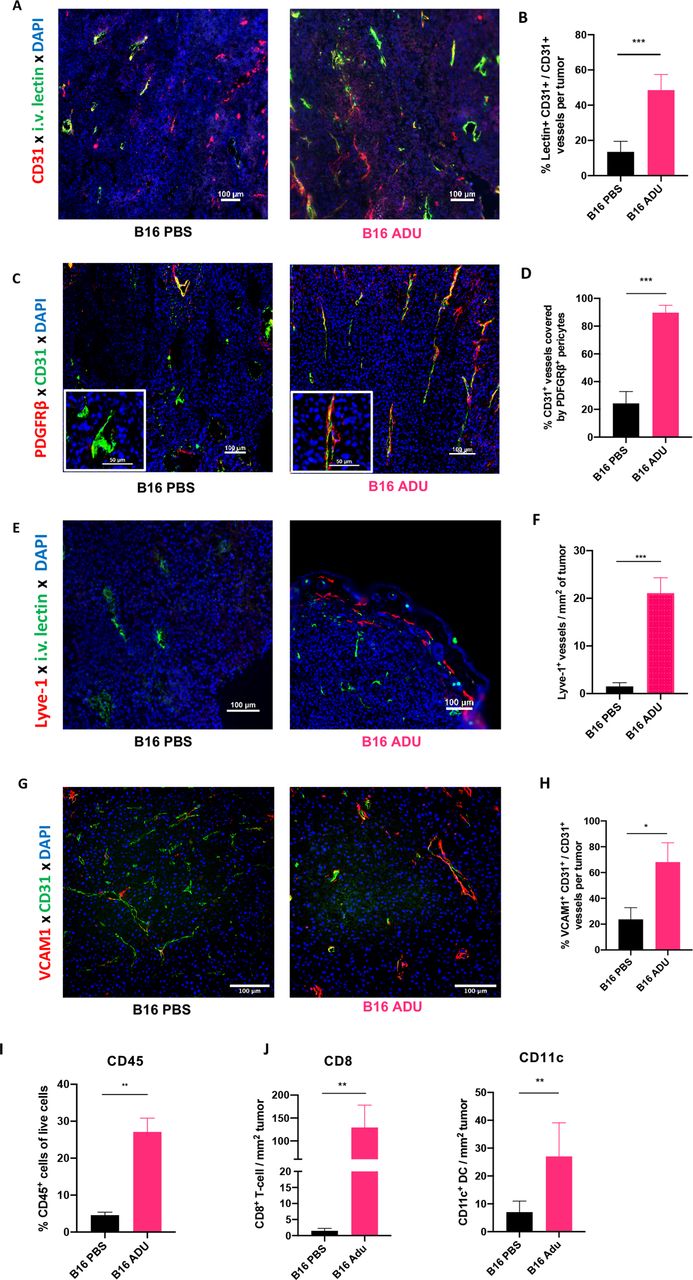
Delivery of low-dose STING agonist into the TME promotes vasculature normalization (VN), lymphangiogenesis and improved immune cell recruitment. (A) Representative images of lectin perfused functional vessels in PBS or ADU S-100 treated B16.F10 melanoma resected 18 days post-tumor inoculation. (B) Quantitation of vessel perfusion in PBS or ADU S-100 treated tumors shown as a function of percent CD31+ VECs containing luminal lectin-AF488. (C) Representative images depicting PDGFRβ+ pericyte coverage on tumor VECs in PBS or ADU S-100 treated B16.F10 tumors resected 18 days post inoculation (inset scale bar=50 µm). (D) Quantitation of the percentage of CD31+ VECs with tightly-approximated (covering) PDGFRβ+ pericytes based on overlapping fluorescence signals at the abluminal VEC surface-pericyte interface. (E) Representative images showing increased abundance of Lyve-1+ lymphatic endothelial cells in ADU S-100 treated B16.F10 tumors. (F) Quantitation of Lyve-1+ LEC density per unit area tumor. (G) Representative images showing VCAM-1 expression on tumor VECs in PBS or ADU S-100 treated B16.F10 melanoma (H) quantitation of VCAM-1 expression on CD31+VECs. (I) Percent quantitation of live CD45+ cells in resected B16.F10 melanoma treated with PBS or ADU S-100. (J) Quantitation of CD8+ T cell and CD11c+ DC infiltrates in ADU S-100 treated or control B16.F10 tumors. Data are representative of three independent experiments. *p < 0.05; ** p < 0.002; ***p < 0.0002. scale bar=100 µm. LEC, lymphatic endothelial cells; TME, tumor microenvironment.
Another specialized vasculature in the TME is the lymphatic endothelial network. Lymphatics serve as draining conduits to lymph nodes (LN), permitting transport of APCs for adaptive immune cell priming in conventional secondary LNs.24 Lymphatic vessels drain interstitial fluid from the TME, thus reducing tumor interstitial fluid pressure (TIFP) and facilitating influx of immune cell populations from the circulation.5 25 Therapeutic lowering of TIFP in the TME via enhanced development of lymphatic vessels represents an additional index of VN5 and has also recently been identified as a positive prognostic indicator in human melanoma.26 In this regard, murine melanomas treated with low-dose STING agonist ADU S-100 exhibited significant increases in the density of Lyve-1+ lymphatic endothelial cells versus PBS-treated control tumors (figure 2E,F).
Importantly, the presence of normalized and activated vascular networks in the therapeutic TME was associated with robust improvement in tumor infiltration by CD45+ immune cells (figure 2I), CD8+ T cells and CD11c+ DCs (figure 2J) after i.t. administration of low-dose ADU S-100.
STING-activated CD11c+ DCs develop VN-inducing and TLS-inducing properties
Having observed an increase in CD11c+ DC infiltration within the ADU S-100 treated TME, and given the pivotal roles played by tumor-associated DCs in cross-priming therapeutic antitumor immune responses, we next sought to characterize the direct impact of STING agonism on DCs. To address this, mCD11c+ BMDCs were treated with PBS or with 2.5 µg/mL ADU S-100 in vitro for 16 hours, after which mRNA expression was profiled using gene chip microarrays. We identified and analyzed ~1300 annotated gene products that were significantly up/downregulated in ADU S-100-treated CD11c+ DCs (|log2FC|>1 and adjusted p<0.05) and observed that their selective expression corresponded with several antitumor Gene Ontology phenotypes (figure 3A, online supplemental figure S3A, S3B). Remarkably, a GSEA on Ingenuity Pathway Analysis (Qiagen) revealed that ADU S-100-activated DCs strongly upregulated expression of gene transcripts associated with the inhibition of angiogenesis (online supplemental figure S4A) and the organogenesis/development and maintenance of lymphoid tissues (figure 3B).

STING activated DCs exhibit TLS inducing characteristics. (A) Visualization of Biological Processes Gene Ontology terms associated with differentially expressed genes (DEG) in sting activated CD11c+ DCs. Go analysis performed using Partek genomics suite, *p < 0.05, one-way ANOVA (B) annotated microarray probes cross-referenced with ingenuity pathway analysis (Qiagen) implicates Deg gene expression of sting activated DCs in promoting their maturation and in the formation, structure and development of lymphoid tissues. (C) STING activated DCs upregulate factors associated with TLS formation.20 (D) Quantitative rtPCR validation of TLS inducing factors highlighted by microarray analysis. (E) Quantitative rtPCR validation showing increased TLS-associated analyte production by CD11c+ DCs directly isolated from digests of tumors treated with ADU S-100 vs PBS in vivo. (F) STING activated DCs demonstrate a more mature phenotype as evidenced by increased transcript levels of DC maturation markers. (G) Flow cytometric validation of DC maturation on STING activation. Data representative of three independent experiments *p < 0.05; **p < 0.002. ANOVA, analysis of variance; DCs, dendritic cells; IFN, interferon TLS; tertiary lymphoid structures.
To expand on these findings, we assessed the expression of targets reported in an ad hoc biomarker panel for TLS formation,27 in addition to other validated DC-centric, pro-TLS factors including lymphotoxins, IL-36β and TNFα.28–33 We observed that STING-activated DCs coordinately upregulate several factors within the ad hoc panel in addition to Lta, Tnfa and Il36b when compared with control PBS-treated DCs (figure 3C). We validated the gene array expression findings at the transcriptional level using qPCR analyzes performed on BMDCs treated with ADU S-100 vs PBS in vitro (figure 3D) and on CD11c+ DCs isolated from digests of tumors treated with ADU S-100 vs PBS in vivo (figure 3E). We further corroborated that the production of these TLS associated factors by DCs relied on an IFNAR-independent, but STING-TBK1-IRF3-dependent signaling cascade (online supplemental figure S5).
Consistent with recent literature linking DC maturation to TLS presence/maintenance in tumors,34 35 microarray findings further suggested that STING activation promotes CD11c+ DC maturation (figure 3F) leading to the development of a CD54hi+CD86hi+CCR7hi+PD-L1+ mature phenotype confirmed by flow cytometry (figure 3G). In sum, our data suggest that STING-activated DCs might serve as sponsors for TLS formation within the TME.
Treatment with low-dose STING agonist promotes formation of non-classical TLS in the therapeutic TME
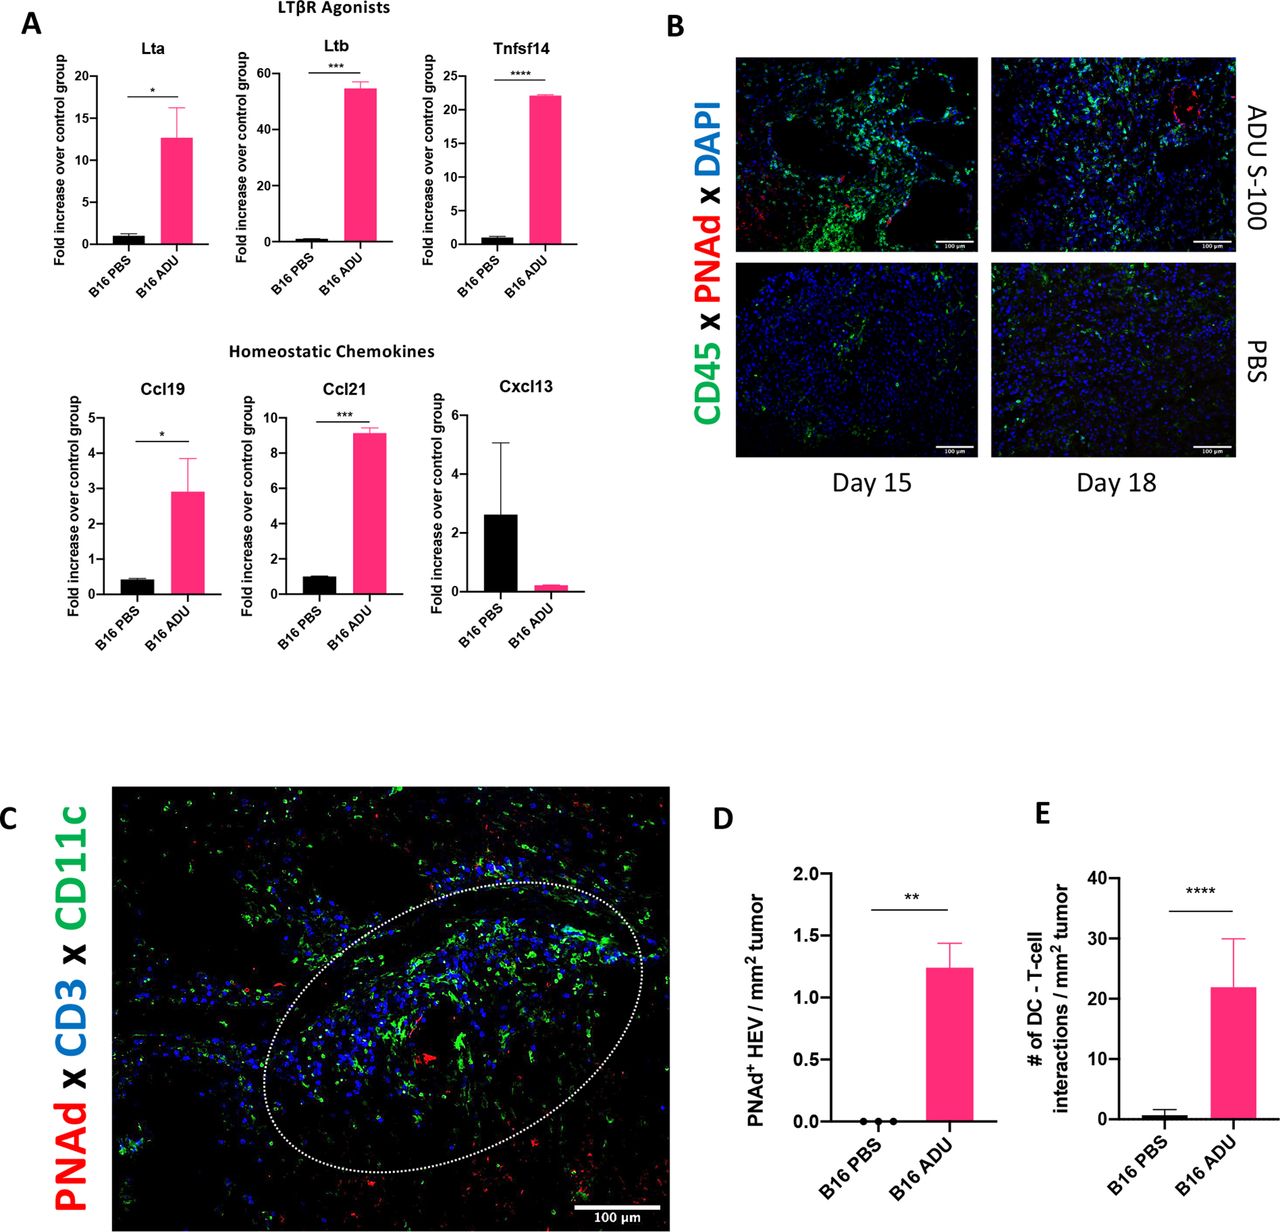
We next investigated whether these STING-driven inflammatory events translated into the development of a pro-TLS TME. Tumors harvested on day 18 were analyzed by qPCR for expression of homeostatic chemokines and lymphotoxin genes associated with development of secondary/tertiary lymphoid tissues.36 When compared with control tumors, ADU S-100-treated tumors expressed elevated levels of homeostatic chemokines Ccl19 and Ccl21 (but not Cxcl13), and the LTβR agonists Lta, Ltb and Tnfsf14/Light (figure 4A), suggesting that intratumoral STING activation promotes a TME favoring TLS neogenesis.

Low-dose STING activation induces non-classical TLS formation in the therapeutic TME. (A) Post-treatment tumor digests obtained on day 18 show increased transcript levels of TLS inducing homeostatic chemokines (Ccl19 and Ccl21) and TLS inducing LTβR agonists (Lta, Ltb and Tnfsf14/Light). (B) Representative immunofluorescent images showing TLS in ADU S-100 treated B16.F10 tumors resected on day 15 (2 injections completed) or on day 18 (3 injections completed) in comparison to PBS treated B16.F10 tumors lacking TLS. (C) Representative image of ADU S-100 treated B16.F10 tumor resected on day 18 showing sting induced non-classical TLS composed of CD11c+ DCs and CD3+ T cells surrounding PNAd+ HEV. (D) TLS formation quantitated using PNAd+ HEV density in PBS or ADU S-100 treated B16.F10 tumors. Data representative of three independent experiments. (E) ADU S-100-treated vs control B16.F10 tumors demonstrate marked increase in number of physical contacts between infiltrating CD11c+ DCs and CD3+ T cells. *p < 0.05; **p < 0.002; ***p < 0.0002; ****p < 0.0001. Scale bar=100 µm. DCs, dendritic cells; TLS, tertiary lymphoid structures; TMS, tumor microenvironment; TNF, tumor necrosis factor.
To determine whether this treatment regimen resulted in the formation of observable TLS, ADU S-100 treated B16.F10 tumors were resected at various time points on-treatment, with tumor sections analyzed by IFM for the presence of TLS. CD45+ immune clusters surrounding PNAd+ HEVs resembling bona-fide TLS37 were identified as early as 5 days after initiating treatment with ADU S-100 (figure 4B). These therapy-induced TLS were richly infiltrated with CD11c+ DCs and CD3+ T cells, resembling previously reported ‘non-classical’ TLS38 (figure 4C). IFM analyzes did not, however, reveal significant B cell infiltrates in our specimens (online supplemental figure S4B); consistent with our observed lack of Cxcl13 expression in the TME of ADU S-100 treated animals (figure 4A). TLS were further quantified using PNAd+ HEV as a canonical biomarker,39 40 revealing that ADU S-100-treated tumors contained more HEVs per unit area of tumor versus control PBS-treated tumor specimens (figure 4D). ADU S-100 treated tumors were also characterized by a marked increase in the number of physical contacts made between CD11c+ DCs and CD8+ T cells within the TME (figure 4E). Hence, treatment with STING agonist ADU S-100 appears to primarily promote non-classical TLS formation within the TME.
Host cell but not melanoma STING signaling drives the anti-tumor response, VN and TLS formation in the TME
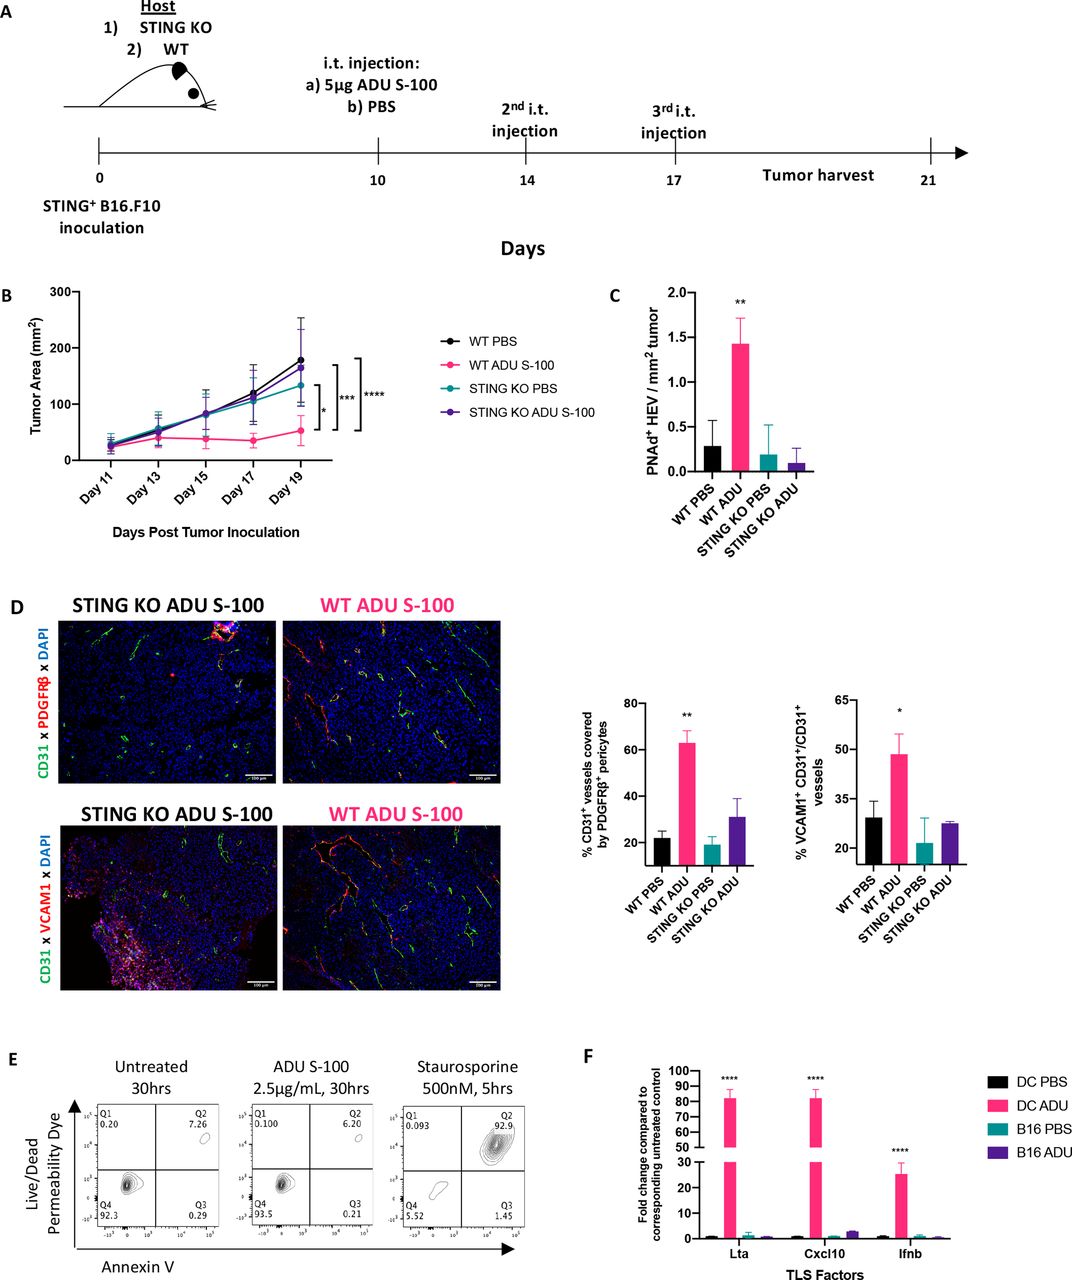
In addition to innate immune cells, B16.F10 melanoma cells intrinsically express STING (data not shown) and could theoretically respond directly to ADU S-100. To parse out the role of tumor-intrinsic STING activation in the observed therapeutic responses, we administered low-dose ADU S-100 to wild-type (WT) or STING gene knockout (KO; Tmem173gt) mice bearing established STING+ B16.F10 melanomas (figure 5A). Interestingly, despite tumor-intrinsic expression of STING in both models, ADU S-100-based therapy failed to effectively treat (figure 5B), promote the development of TLS-associated PNAd+ HEVs in the TME (figure 5C) or promote VN (figure 5D) in B16.F10-bearing STING KO mice (vs WT mice).

Host STING expression is required for therapeutic VN, TLS neogenesis and treatment benefit. (A) Schematic representation of animal experiments performed using WT and sting KO (Tmem173gt) mice. Treatment timelines for PBS or ADU S-100 were identical as in previous experiments. All mice received S.C. injections of STING+ B16.F10 tumors. (n=5/group) (B). Tumor growth curves of WT and sting KO mice showing observed therapeutic effect in only the ADU S-100 treated WT host group. *p < 0.05, ***p < 0.0002; ****p < 0.0001, two-way ANOVA. (C) Quantitation of HEVs in WT host or sting KO host receiving ADU S-100 or PBS **p < 0.002, one-way ANOVA. (D) Representative images showing VN as a function of pericyte coverage and VEC activation in tumors resected from WT hosts, but not from sting KO hosts, treated with ADU S-100. *p < 0.05; **p < 0.002, one-way ANOVA. (E) Representative flow cytometric plots from apoptosis assay on cultured B16.F10 cells confirming sting agonism is not directly tumoricidal. (F) Quantitative rtPCR validation of the lack of response to sting activation in B16.F10 cells (as compared with responsive CD11c+ DCs). ****p < 0.0001, one-way ANOVA. Scale bar=100 µm. ANOVA, analysis of variance; DC, dendritic cell; i.t, intratumorally; rtPCR, real time PCR; TLS, tertiary lymphoid structures; VN, vascular normalization.
In extended studies, we determined that treatment of B16.F10 melanoma cells in vitro with ADU S-100 failed to promote tumor cell apoptosis (figure 5E) or tumor cell production of TLS promoting factors or canonical STING pathway gene activation (figure 5F). These data emphasize: (1) the selective importance of STING activation in host cells for the observed therapeutic effects of ADU S-100 administered into the TME and (2) an apparent intrinsic defect in STING signaling in B16.F10 cells in response to ADU S-100.
Therapeutic sting activation expands a TIL repertoire unique to the Tme
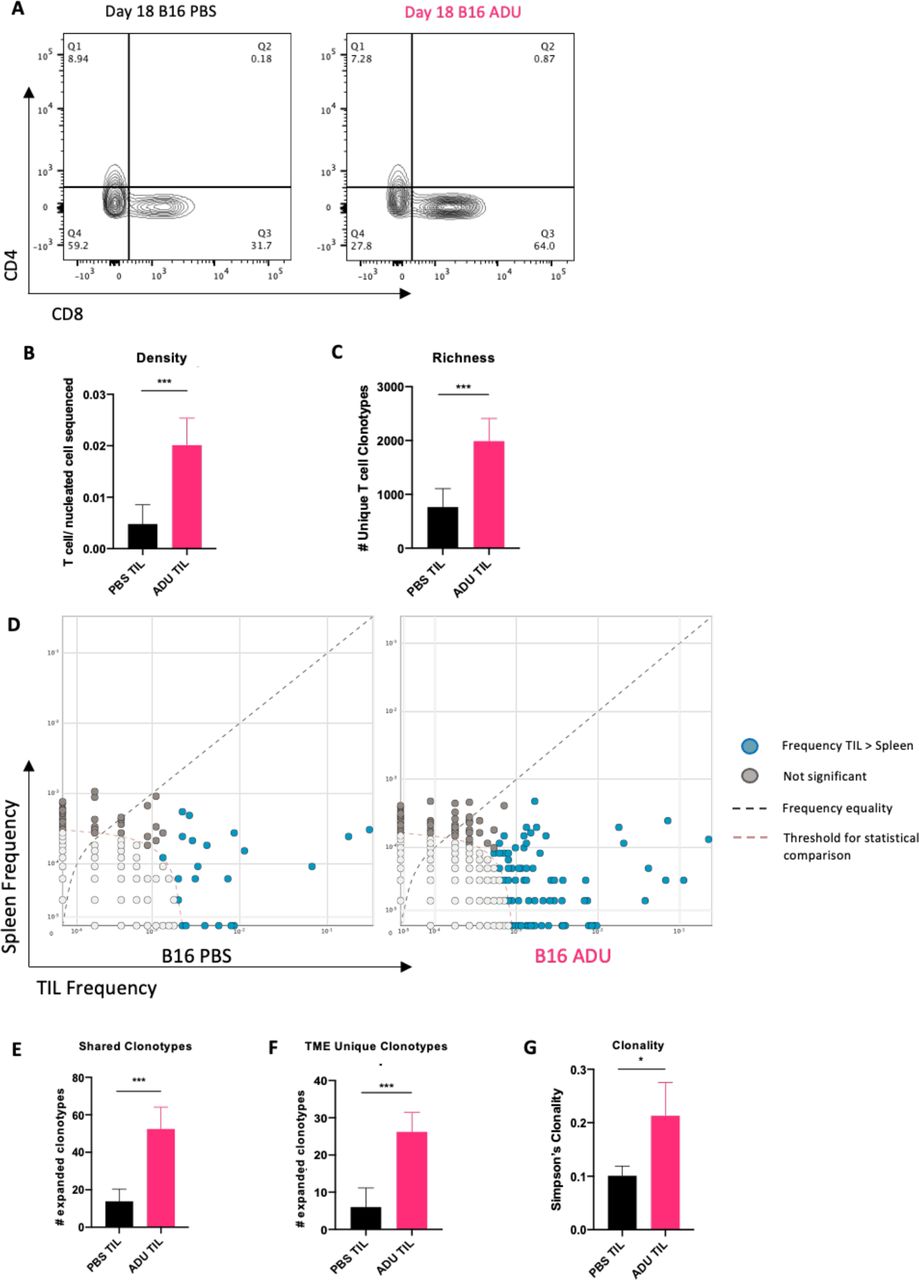
ADU S-100 treated tumors exhibited increased infiltration by CD3+/CD8+ T cells (figure 6A). To distinguish how therapy impacted the day 18 TIL repertoire, we performed TCRseq analyzes of the TCRβ-CDR3 repertoires of TILs and animal-matched splenocytes isolated from STING agonist-treated versus control-treated tumor-bearing mice.

Therapeutic STING activation expands a TIL repertoire unique to the TLS+ TME. (A) representative flow cytometry plots from day 18 ADU S-100 treated or control tumors showing increased infiltration of CD8+ T cells post-STING activation. (B) TCRseq analysis confirming increased T cell presence in ADU S-100 treated bulk tumor samples sequenced. (C) TILs in ADU S-100 treated tumors characterized by increased populational richness (greater number of divergent clonotypes/sample). (D) differential abundance plots comparing relative frequencies of expanded clonotypes (using cut-off clonal count >10) between matched TILs and splenocytes. (E) ADU S-100 treated tumors (vs control tumors) exhibit expansion in T cell clonotypes common to peripheral tissues (ie, spleen). (F) ADU S-100 TILs (vs control TILs) contain expanded T cell clonotypes unique to the Tme. (G) TILs in ADU S-100 treated tumors demonstrate increased clonality (more oligoclonal) compared with TILs from PBS-treated tumors. n=5/cohort. TCRseq differential abundance calculated using non-parametric two-tailed t-tests (bH <0.01, p-value<0.05) on ImmunoSEQ analyzer 3.0. *p<0.05; ***p < 0.0002; ****p<0.0001.
Quantitative TCRseq comparisons demonstrated an increase in the ratio of T cells (ie, TIL) per nucleated cell sequenced within ADU S100-treated tumor samples consistent with our flow cytometry data (figure 6B). This metric also normalizes quantitative sequencing bias across all samples. We next compared productive TCR rearrangements, indicative of the number of distinct T cell clonotypes (as an index of population richness) within TIL and observed a significant increase in the number of productive TCR rearrangements within the ADU S-100 treated TILs when compared with control TILs (figure 6C). This suggested that the STING-activated TME supports improved infiltration of divergent T cell clonotypes when compared with control tumors. To parse out the source of the therapy-associated repertoire observed within ADU S-100 TILs, we compared frequencies of clonotypes in ADU S-100 treated or control TILs with animal-matched splenocytes (figure 6D). We hypothesized that local STING activation, by virtue of its induction of VN and TLS formation, would not only increase recruitment of clonotypes cross-primed in the periphery (as indexed in spleen), but also initiate de novo expansion of unique clonotypes based on local T cell cross-priming within the TME. When expanded clonotypes (clonal count >10) were compared between animal-matched spleen and tumor specimens, we indeed observed significant increases in TIL clonotypes shared with spleen in ADU S-100 treated tumors vs control tumors, supportive of VN-enhanced recruitment of peripherally expanded T cells (figure 6E). Further, when compared with control mice, we also observed a significant increase in the number of expanded clonotypes unique to the TME (vs spleen) after treatment with ADU S-100 (figure 6F). These quantitative and compartmental changes in T cell clonotypes in ADU S-100-treated versus control-treated animals resulted in an overall increase in oligoclonality of the therapeutic TIL TCR repertoire (figure 6G). These data support the notion of independent evolution of the therapeutic TCR in both the periphery and in the TLS+ TME of ADU S-100-treated mice.
Discussion
Novel findings presented in our report include the ability of low-dose STING agonist ADU S-100 to mediate therapeutic inhibition of melanoma growth by coordinately: (1) promoting tumor VN and lymphangiogenesis, (2) stimulating CD11c+ DC maturation and local production of VN-promoting and TLS-promoting factors, (3) facilitating enhanced immune cell infiltration and the induction of non-classical TLS formation (devoid of organized B cell regions, ie, germinal centers (GC) in the TME and iv.) enhancing the quantity and richness of the TIL repertoire within the therapeutic TME of TLS+ melanomas. The observed in vivo therapeutic benefits associated with ADU S-100 treatment required STING expression in host cells and were independent of intrinsic STING signaling in tumor cells. Indeed, STING signaling in the B16 and BPR murine tumor cell lines appears dysfunctional (Chelvanambi et al, manuscript in preparation), a finding consistent with recent published analyzes of human colon carcinomas and melanomas.41
Our data suggest a mechanism in which low-dose STING activation reprograms several aspects of the melanoma vasculature to confer immunotherapeutic benefit. First, by increasing local production of anti-angiogenic factors, STING activation helps normalize the melanoma vasculature to restore tissue normoxia and the functionality of these major conduits for recruitment of circulating immune cells. Our findings in melanoma models parallel observations by Yang and colleagues in lung carcinoma models for the ability of STING agonists to serve as conditioning agents to promote VN and to synergize with therapeutic checkpoint blockade.42 Second, STING activation promotes the local production of homeostatic chemokines and LTβR agonists to sponsor the formation of HEVs/TLS within the TME, where local (cross)priming of naïve/central memory T cells may take place. We show that both cultured BMDCs treated with ADU S-100 and CD11c+ DCs isolated from the ADU S-100-treated TME exhibit improved maturation and enhanced production of factors supportive of TLS/HEV neogenesis, without excluding the possible additional contributions of other STING responsive (non-tumor) cell types found within the TME. Future studies using scRNAseq are expected to shed light on the selective/relative contributions of other cell types (macrophages, VECs, fibroblasts, stromal cells, etc) for their roles in promoting VN and HEV/TLS formation.
Biophysically, VN and lymphangiogenesis together serve to reduce TIFP, permitting improved transendothelial diffusion and convection of luminal contents including small molecule drugs and immune effectors into the TME.43 Together with improved endothelial cell activation, STING agonist-treated vessels are expected to actively recruit and shuttle immune effectors into the tumor interstitium. Through HEV neogenesis and by virtue of approximating (DC-mediated) antigen cross-priming at source sites of antigen load, TLS are expected to improve TIL infiltration and local T cell cross-priming, leading to an expanded, diversified antitumor TCR.
Indeed, through analysis of the TIL TCRβ-CDR3 sequences, we observed an increase in the richness, clonality and uniqueness of the TIL repertoire of STING agonist-treated tumors versus control tumors, suggesting therapeutic benefits likely result from the participation of both peripherally and locally expanded TIL clonotypes. This finding may explain the widely observed improvement in efficacy of ICB when combined with STING agonists, wherein preconditioning tumors with STING activation may facilitate TLS formation and the development of locally expanded and diversified TCR best adapted to react to antigenically heterogeneous tumor clonotypes.2 44–46 Clonotypic comparisons of TILs with animal-matched splenic T cells revealed that TILs from ADU S-100 treated mice were significantly enriched with, both, peripherally shared clonotypes (primed within SLOs) and TME-unique clonotypes which qualitatively support the likely therapeutic relevance of VN and TLS neogenesis on-treatment with STING agonists. While our study, and a majority of TLS studies, cannot conclusively demonstrate that the detected TME-unique T cell clonotypes were cross-primed within therapy-induced TLS, our findings are consistent with other studies linking TLS and local T cell cross-priming47 48 and the diversification of disease-relevant TCR via an epitope spreading paradigm.49 Future studies characterizing the tumor antigen specificity of engineered T cells bearing the TME/TLS-restricted CDR3 sequences as found within ADU S-100 treated tumors may provide additional support for their therapeutic relevance and contribute to the design of novel adoptive cell therapy approaches in the melanoma/cancer setting.
Recently, B cells have been reported to represent a positive prognostic biomarker in human solid cancers by virtue of their production of antitumor antibodies and their ability to serve as tumor-resident APCs.50–54 B cells have also been reported to promote a pro-TLS tissue microenvironment based on their robust production of LIGHT/TNFSF14.55 However, in our studies, we did not observe significant B cell infiltration, GC formation or the development of classical TLS (online supplemental figure S4B). Consistent with this finding, neither our GSEA of ADU S-100-treated DCs nor transcriptional analyzes of tumor specimens identified pathways relevant to B cell recruitment/infiltration or the initiation of humoral responses (online supplemental figure S3A, S4A). Furthermore, we found no evidence for increased local production of the B cell homeostatic chemokine CXCL13 post-treatment with ADU S-100 in DCs (figure 3G) or tumors (figure 4A). Given these findings, treatment strategies combining STING agonists with agents that promote B cell, follicular DC and/or TFH recruitment into the TME might lead to the more effective formation of classical mature TLS in the TME, resulting in enhanced treatment benefit. Candidate agents that activate TLR7/9 on DCs56 57 or that block DNMT1 (decitabine) in the TME to promote enhanced CXCL13 production could be considered for use in such combination protocols.58 However, one should also carefully consider previous reports linking B cells with tumor progression.59–62 Regardless of the ultimate role for B cells in a therapeutic TLS paradigm, it is noteworthy that in humans, the presence of either classical/mature or non-classical (ie, B-deficient) TLS in the TME correlates with improved patient outcome when compared with patients with tumors that fail to exhibit TLS.38
While our studies were not specifically designed to identify mechanisms underlying resistance to i.t.-delivered STING agonist-based monotherapy that may have led to modest clinical activity in early-phase clinical trials, we observed that the treatment of DCs with ADU S-100 resulted in the compensatory upregulation of several known regulatory molecules that would be expected to mediate anti-inflammatory activity and thereby limit the therapeutic anti-tumor immune response. Notably, we observed that PD-L1, Ptgs2/COX2, Ptges and Arg2 expression were strongly upregulated on STING-activated DCs, suggesting these APCs may not mediate optimal/sustained immunostimulatory activity in vivo (online supplemental figure S6).63 Other preclinical studies have indeed demonstrated therapeutic synergy when combining STING agonists with checkpoint inhibitors44–46 or COX-2 inhibitors15 in vivo, suggesting that antagonism of immunoregulatory pathways induced by STING activation might prove crucial for successful treatment of multifocal, advanced-stage disease. We are currently investigating the therapeutic impact of combined treatment with STING agonists+anti-PD-L1 and/or inhibitors of PTGES, PTGS2/COX-2 and ARG2 to determine impact on VN, TLS formation, TIL repertoire and tumor growth in our murine melanoma models.
Finally, a number of studies, including ours, have highlighted the local therapeutic benefits of intratumoral STING activation using second-generation agents (ie, MIW-815/ADU S-100, E7766), but these interventions lead to only modest therapeutic impact on distal, untreated lesions in multifocal disease models in which only one tumor is treated (online supplemental figure S7), Furthermore, systemic (i.p.) delivery of ADU S-100 fails to effectively treat s.c. B16.F10 tumors in vivo (data not shown). Given these logistic limitations for second-generation STING agonists, there is significant enthusiasm for future investigation of next-generation small molecule STING agonists designed for systemic delivery that have entered evaluation in early-phase clinical trials (ie, SB11285 and GSK3745417). These agents will enable further testing of our proposed therapeutic paradigm in models of multifocal, disseminated melanoma treated i.v./i.p. with low doses of STING agonists.
Acknowledgments
The authors wish to thank Dr John Alcorn for generously providing IFNAR KO specimens used in the performance of studies detailed in this report. We would also like to thank Dr Deena M. Maurer and Ms Jessica N. Filderman for their thoughtful input on experimental design and Dr Robert J. Binder for his careful review and helpful comments provided during the preparation of this manuscript.
References
Supplementary materials
Supplementary Data
This web only file has been produced by the BMJ Publishing Group from an electronic file supplied by the author(s) and has not been edited for content.
Supplementary Data
This web only file has been produced by the BMJ Publishing Group from an electronic file supplied by the author(s) and has not been edited for content.
Footnotes
Contributors MC and WJS designed experiments. MC, RJF and JLT performed experiments. MC and WJS interpreted data. MC and WJS wrote the paper. All authors read and agreed on the final version of the submitted manuscript.
Funding This project was supported by the NIH under Grants R01 CA169118, R01 CA204419 and P01 CA234212 (to WJS).
Competing interests None declared.
Patient consent for publication Not required.
Ethics approval All mice were housed in a pathogen-free facility at the University of Pittsburgh and handled according to protocols approved by the Institutional Animal Care and Use Committee (IACUC).
Provenance and peer review Not commissioned; externally peer reviewed.
Data availability statement All data published in this report are available on reasonable request.
Supplemental material This content has been supplied by the author(s). It has not been vetted by BMJ Publishing Group Limited (BMJ) and may not have been peer-reviewed. Any opinions or recommendations discussed are solely those of the author(s) and are not endorsed by BMJ. BMJ disclaims all liability and responsibility arising from any reliance placed on the content. Where the content includes any translated material, BMJ does not warrant the accuracy and reliability of the translations (including but not limited to local regulations, clinical guidelines, terminology, drug names and drug dosages), and is not responsible for any error and/or omissions arising from translation and adaptation or otherwise.