


Abstract
Medroxyprogesterone acetate (MPA) is one of the most frequently prescribed progestins for conception, hormone replacement therapy, and adjuvant endocrine therapy. MPA has a low oral bioavailability because of extensive metabolism; however, its metabolism was poorly documented. This study was intended to profile the phase I metabolites of MPA and the cytochrome P450 (P450) isoforms involved. After MPA was incubated with human liver microsomes and the NADPH-generating system, five main metabolites (namely M-1, M-2, M-3, M-4, and M-5) were isolated by high-performance liquid chromatography. Three major metabolites (M-2, M-4, and M-3) were tentatively identified to be 6β-, 2β-, and 1β-hydroxy MPA by liquid chromatography/mass spectrometry and 1H nuclear magnetic resonance. By consecutive metabolism of purified M-2, M-3, and M-4, M-1 and M-5 were proposed to be 2β-, 6β-dihydroxy MPA, and 1,2-dehydro MPA, respectively. CYP3A4 was identified to be the isoform primarily involved in the formation of M-2, M-3, and M-4 in studies with specific P450 inhibitors, recombinant P450s, and correlation analysis. Rat and minipig liver microsomes were included evaluating species differences, and the results showed little difference among the species. In human liver microsomes, the Km values ranged from 10.0 to 11.2 μM, and the Vm values ranged from 194 to 437 pmol/min/mg for M-2, M-3, and M-4. In conclusion, CYP3A4 was the major P450 isoform involved in MPA hydroxylation, with 6β, 2β, and 1β being the possible hydroxylation sites. Minipig and rat could be the surrogate models for man in MPA pharmacokinetic studies.
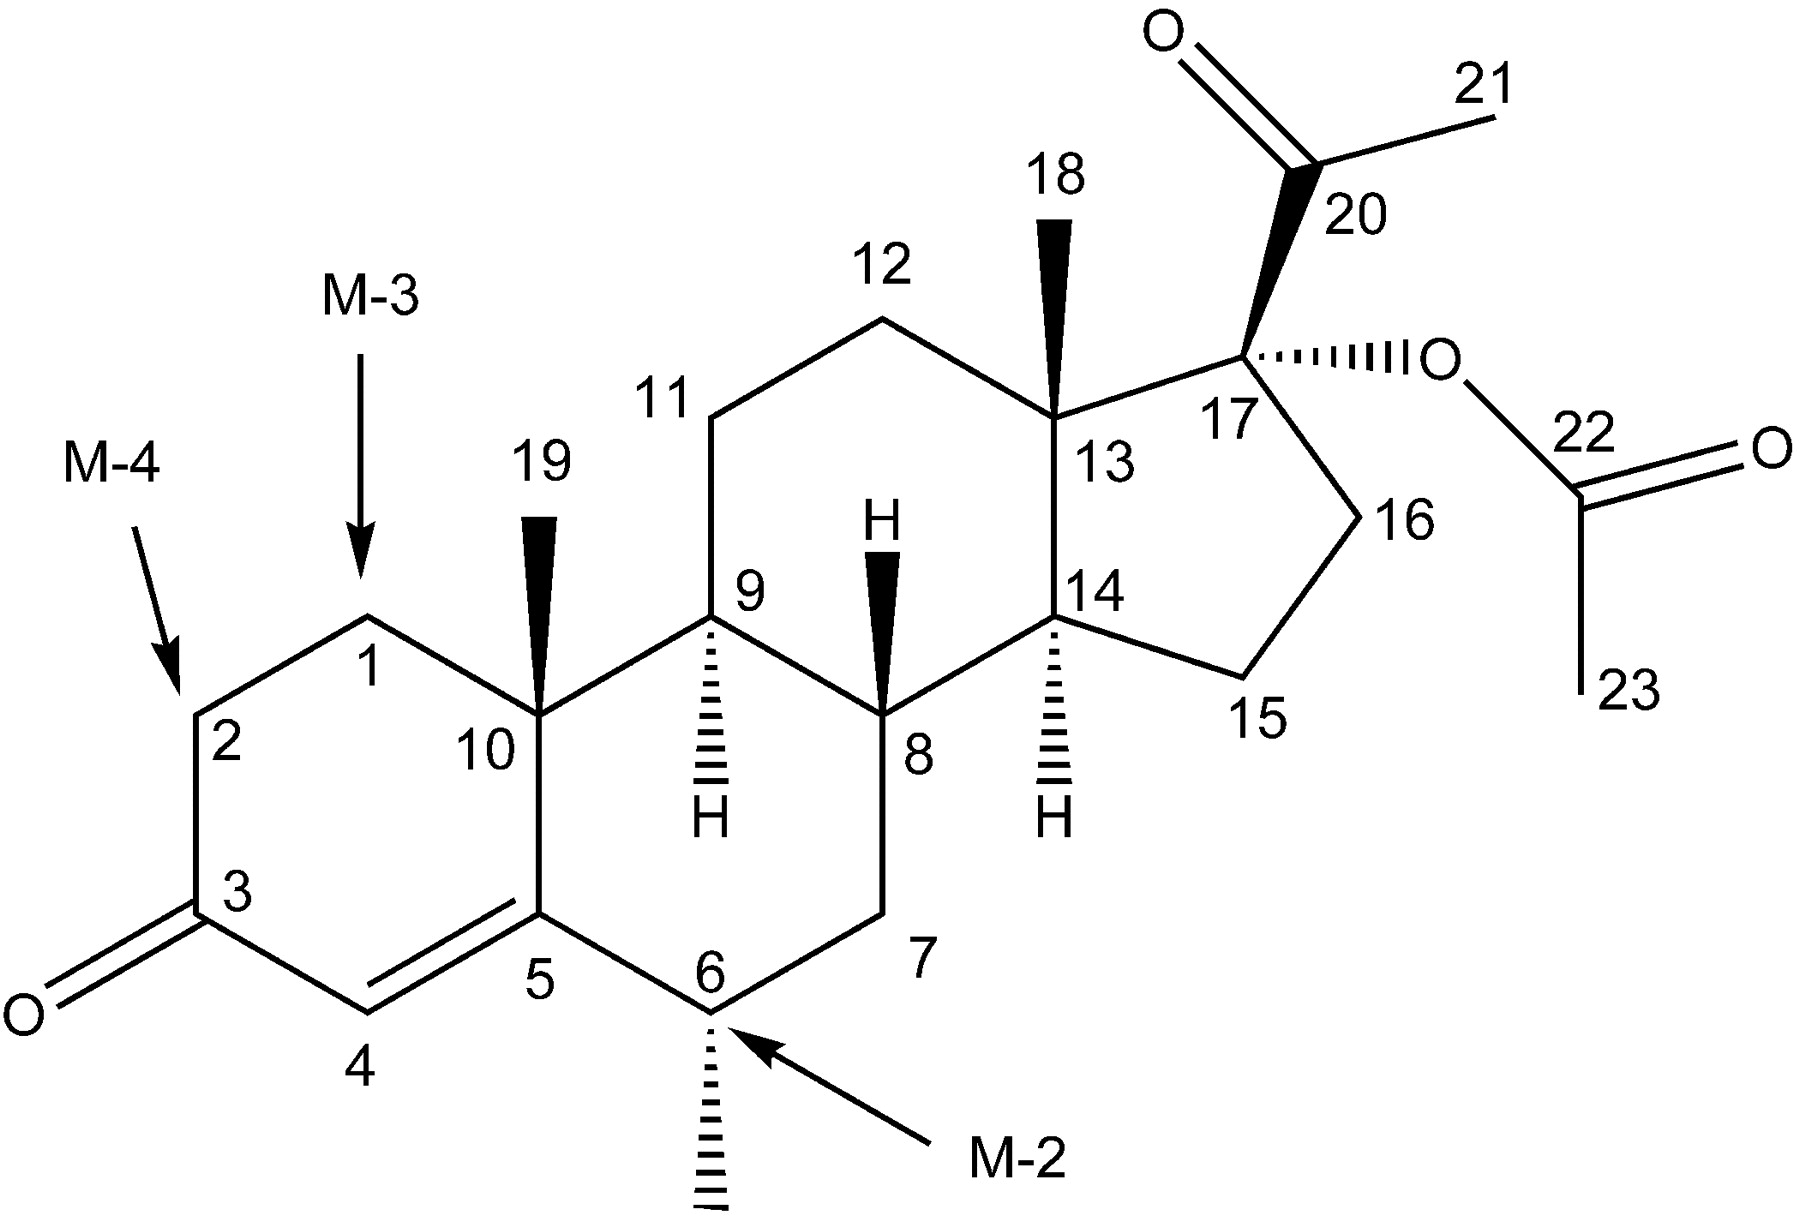
Medroxyprogesterone acetate (17α-acetoxy-6α-methylpregn-4-ene-3,20-dione; MPA) (Fig. 1), a synthetic progesterone analog, was used in conception and hormone replacement therapy (HRT) by millions of women worldwide (Ratchanon and Taneepanichskul, 2000). In the Unite States, MPA is the most common HRT progestin in use (Ghatge et al., 2005; Singh, 2007; Otto et al., 2008) and one of the most popular oral conceptive among adolescent girls (Cromer et al., 2004). In large doses, MPA is used in adjuvant endocrine therapy to treat endometrial cancer and breast cancer (Ghatge et al., 2005). MPA was an immunosuppressant, and its potential to treat a number of inflammatory conditions was in clinical trial (Adis International Ltd., 2003).
MPA has a longer half-life than progesterone and can be administrated orally (Ghatge et al., 2005). The oral bioavailability of MPA was low, which was estimated to be 5 to 15% (Fotherby, 1996). Serum MPA concentration would plateau when the oral dose exceeded 1000 mg/day (Etienne et al., 1992). Poor oral bioavailability probably resulted from its low solubility and intense metabolism in the gastrointestinal tract and the liver.
There were considerable reports concerning the adverse effects of MPA, such as irregular bleeding, amenorrhea, weight gain, and thrombosis (Chotnopparatpattara and Taneepanichskul, 2000). Our previous findings suggested that there was possibility of drug-drug interactions when MPA was coadministrated with drugs cleared by CYP2C9 (Zhang et al., 2006). Because of the adverse effects, MPA had a high discontinuation rate in contraception (Bonny et al., 2004). Researches from Women's Health Initiative Trial indicated that the addition of MPA to conjugated equine estrogens significantly increased the risk of breast cancer (Rossouw et al., 2002; Chlebowski et al., 2003) in HRT. Prescriptions for MPA declined dramatically (Hersh et al., 2004; Wood et al., 2007) thereafter, and the reasons for increased breast cancer risk were under intense investigation (Ghatge et al., 2005; Wood et al., 2007; Otto et al., 2008). A recent study suggested that MPA underwent metabolic activation to reactive species that were genotoxic (Siddique et al., 2006). This process was both rat liver S9 (P450) and NADPH dependent (Siddique et al., 2006). It is not clear how the metabolites were activated into reactive species; therefore, it is important to study the metabolic pathway of MPA.
The aim of present study is to identify the main metabolites of MPA in human liver microsomes (HLMs) and the main P450 isoforms involved. Metabolism of MPA was also conducted with minipig liver microsomes (PLMs) and rat liver microsomes (RLMs) to compare the species differences.

Structure of MPA. Arrows denote proposed hydroxylation sites for its main metabolites.
Materials and Methods
Chemicals.d-Glucose 6-phosphate, glucose-6-phosphate dehydrogenase, NADP+, sulfaphenazole, quinidine, clomethiazole, furafylline, 8-methoxypsoralen, omeprazole, and MPAs were purchased from Sigma-Aldrich (St. Louis, MO). Ketoconazole was obtained from MP Biomedicals (Irvine, CA). S-Mephenytoin was purchased from Toronto Research Chemicals Inc. (North York, ON, Canada). Montelukast sodium was obtained from Beijing Aleznova Pharmaceutical Co., Ltd. (Beijing, China). Triethylenethiophosphoramide (thioTEPA) was purchased from Acros Organics (Fairlawn, NJ). All other reagents were of HPLC grade or of analytical grade. cDNA-expressed recombinant CYP1A2, CYP2A6, CYP2B6, CYP2C9, CYP2D6, CYP2E1, and CYP3A4 derived from baculovirus-infected insect cells coexpressing NADPH-P450 reductase were obtained from BD Gentest (Woburn, MA). cDNA-expressed CYP2C8 and CYP2C19 in Escherichia coli coexpressing NADPH-P450 reductase were purchased from New England Biolabs (Ipswich, MA).
Preparation and Characterization of Liver Microsomes. Human livers were obtained from autopsy samples (n = 9, male Chinese, ages from 27-48) from Dalian Medical University (Dalian, China), with the approval of the ethics committee of Dalian Medical University. The medication history of the donors was not known. Research involving human subjects was done under full compliance with government policies and the Helsinki Declaration.
Procedures involving animals complied with the Laboratory Animal Management Principles of China. Sprague-Dawley rats (n = 10, male; weight, 180-220 g) were purchased from Dalian Medical University. The animals had free access to tap water and pellet diet. The rats were euthanized by decapitation, and livers were rapidly excised and pooled for preparation of microsomes.
Colony-bred Chinese Bama minipigs weighing 10 to 12 kg (n = 6, male, age 6 months) were obtained from Department of Animal Science, Third Military Medical University, China. The animals used are descendants of sows and boars obtained from the original stock at Bama County (GuangXi Province, China). The animals were euthanized by i.v. injection of pentobarbital sodium (150 mg/kg b.wt.); tissue samples were taken from the left medial lobe of the liver within 5 min after death. Liver samples were pooled together to prepare microsomes.
Liver specimens were stored in liquid nitrogen until preparation of microsomes. Microsomes were prepared from liver tissue by differential ultracentrifugation as described previously (Li et al., 2006). Protein concentration was determined by using bovine serum albumin as standards (Lowry et al., 1951). Total P450 concentration was determined according to Omura and Sato (1964) with the use of molar extinction coefficient 91 mM/cm. Liver microsomes were diluted to 10 mg/ml and were stored at -80°C. P450 concentration was 0.63, 0.52, and 0.23 to 0.39 nmol/mg in PLMs, RLMs, and HLMs, respectively.
Incubation System. The incubation mixture, with a total volume of 200 μl, included 100 mM potassium phosphate buffer, pH 7.4, NADPH-generating system (1 mM NADP+, 10 mM glucose 6-phosphate, 1 unit/ml glucose-6-phosphate dehydrogenase, and 4 mM MgCl2), liver microsomes (0.3 mg/ml), and MPA (10 μM). MPAs were previously dissolved in methanol, with a final methanol concentration below 1% (v/v) in the reaction mixture. After 3-min preincubation at 37°C, the reaction was initiated by adding the NADPH-generating system. After incubation for 10 min in a shaking water bath, the reaction was terminated by the addition of methanol (100 μl). The mixture was kept on ice until it was centrifuged at 20,000g for 10 min at 4°C. Aliquots of supernatants were transferred for HPLC analysis. Control incubations without NADPH or without substrate or without microsomes were included to ensure that metabolite formation was microsome and NADPH dependent. All incubations were carried out in duplicate, and results were expressed as mean ± S.D.
HPLC/MS Method. The HPLC system (Shimadzu, Kyoto, Japan) consisted of an SCL-10A system controller, two LC-10AT pumps, an SIL-10A autoinjector, and an SPD-10AVP UV detector, and a Shim-pack (Shimadzu) C18 column (4.6 × 150 mm, 5 μ) was used to separate MPA and its metabolites. The mobile phases were solvent B, H2O, and solvent A, CH3OH, with linear gradient from initially 52 to 80% A over 20 min. The eluent was monitored at 254 nm, with a flow rate of 1 ml/min.
LC/MS was used to characterize the structures of MPA metabolites. The HPLC eluent from detector was introduced into the mass spectrometer via a 1:4 split. The mass spectrometer was a TSQ triple quadrupole (Thermo Fisher Scientific, Waltham, MA) equipped with an electrospray ionization interface. The spray voltage was 4.5 kV, and the capillary temperature was 300°C. Nitrogen was used as a nebulizing and auxiliary gas. The nebulizing gas backpressure was set at 40 psi, and auxiliary gas was set at 20 (arbitrary units). Initially, the mass spectrometer was programmed to perform full scans between m/z 200 and 500 to observe the [M+H]+ and [M-H]- signals.
Metabolite Purification. PLMs were used to prepare MPA metabolites because they resemble HLMs in MPA metabolism. The incubation system was scaled up to 500 ml. MPA (200 μM) was incubated with PLMs (1.0 mg/ml) and the NADPH-generating system (1 mM NADP+, 10 mM glucose 6-phosphate, 1 unit/ml glucose-6-phosphate dehydrogenase, and 4 mM MgCl2) for 60 min at 37°C. Under these conditions, about 5, 3, and 5% of MPA was converted to M-2, M-3, and M-4, respectively. Methanol (250 ml) was added to the reaction mixture to precipitate the protein. After centrifuged at 9000g for 10 min, the supernatant was separated and extracted with ethyl acetate (250 ml × 3). The organic layer was combined and dried in vacuo. Then, the residue was dissolved in ethyl acetate (1 ml) and separated by preparative thin layer chromatography (Silica gel, 20 × 20 cm, 2 mm; Merck, Darmstadt, Germany), which was developed by chloroform/acetone (9:1, v/v) (McCamish et al., 1980). MPA and its metabolites were monitored under UV light at 254 nm. The metabolites were isolated, and they were further purified by HPLC. The purity of M-2, M-3, and M-4 was about 99, 97, and 99% (HPLC), respectively.
NMR Spectroscopy. Proton NMR spectra were obtained at 400 MHz on a Bruker AV-400 spectrometer (Bruker, Newark, DE). Compounds were dissolved in CDCl3, and experiments were conducted at 21°C. Chemical shifts are reported in parts per million with reference to tetramethylsilane.
Assay with Recombinant P450s. cDNA-expressed recombinant human P450 isoforms coexpressing NADPH-P450 reductase either from insect cells (CYP1A2, CYP2A6, CYP2B6, CYP2C9, CYP2D6, CYP2E1, and CYP3A4) or from E. coli (CYP2C8 and CYP2C19) was used. The incubations were carried out as described for the human liver microsomal study. To examine the contribution of each P450 isoform, MPA (100 μM) was incubated with each of the recombinant P450s (40-80 nM) at 37°C for 30 min. HPLC with UV detection was used to monitor possible metabolites. Relatively high substrate concentration was selected so that adequate metabolites were generated for the convenience of detection.
Correlation Study. Correlation studies were performed by incubation of MPA (10 μM, near Km value) with liver microsomes (0.3 mg/ml) from nine individual donors for 10 min. The isoform specific maker reactions were as follows (Zhang et al., 2007): phenacetin O-deethylation (CYP1A2), coumarin 7-hydroxylation (CYP2A6), paclitaxel 6α-hydroxylation (CYP2C8), diclofenac 4′-hydroxylation (CYP2C9), S-mephenytoin 4′-hydroxylation (CYP2C19), dextromethorphan O-demethylation (CYP2D6), chlorzoxazone 6-hydroxylation (CYP2E1), paclitaxel 3′-p-hydroxylation (CYP3A4), and testosterone 6β-hydroxylation (CYP3A4). The correlation parameter was expressed by the linear regression coefficient (r).
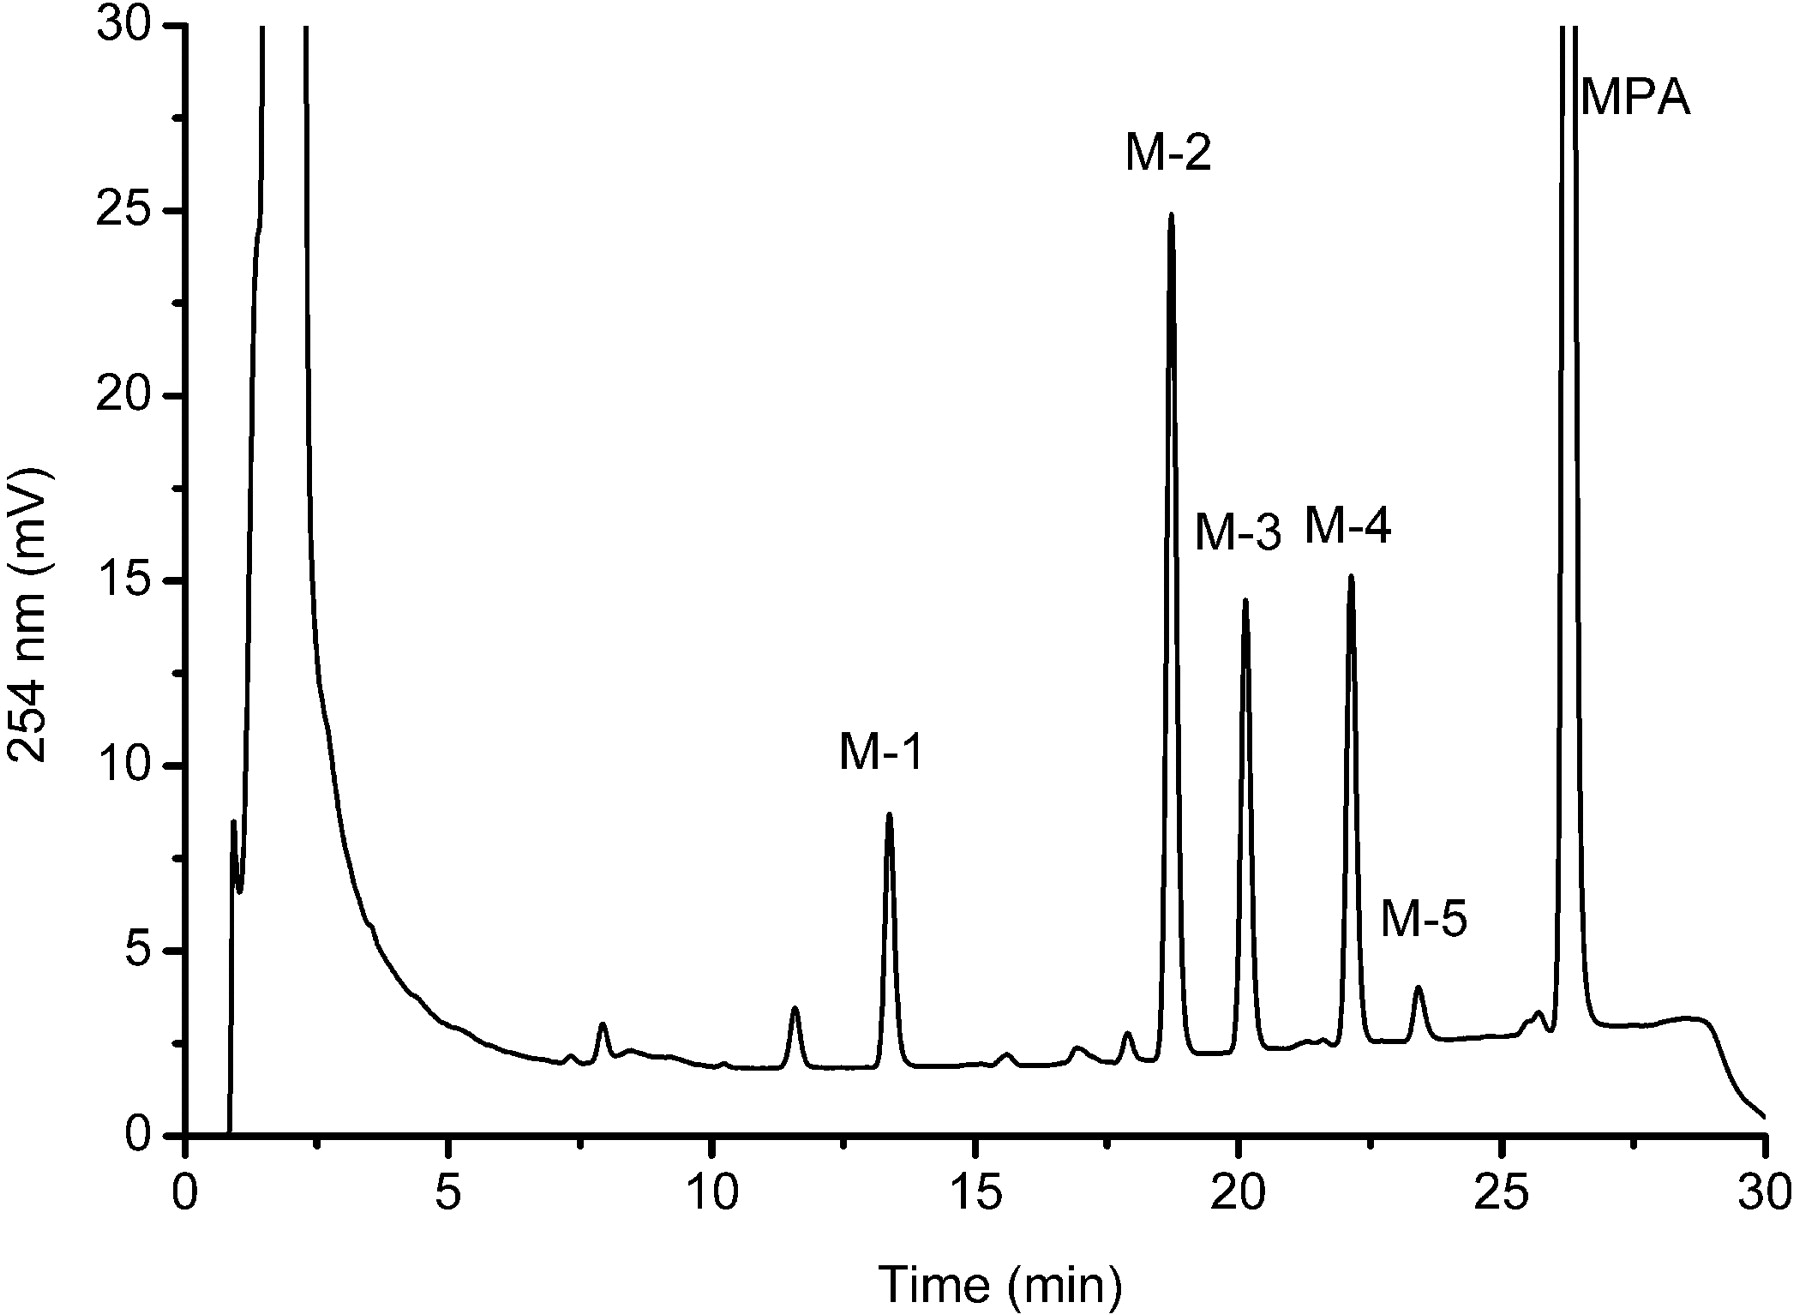
Representative HPLC profiles of MPA and its metabolites (M-1-M-5). MPA (100 μM) was incubated with HLMs (0.5 mg/ml) at 37°C for 30 min with the NADPH-generating system as described under Materials and Methods.

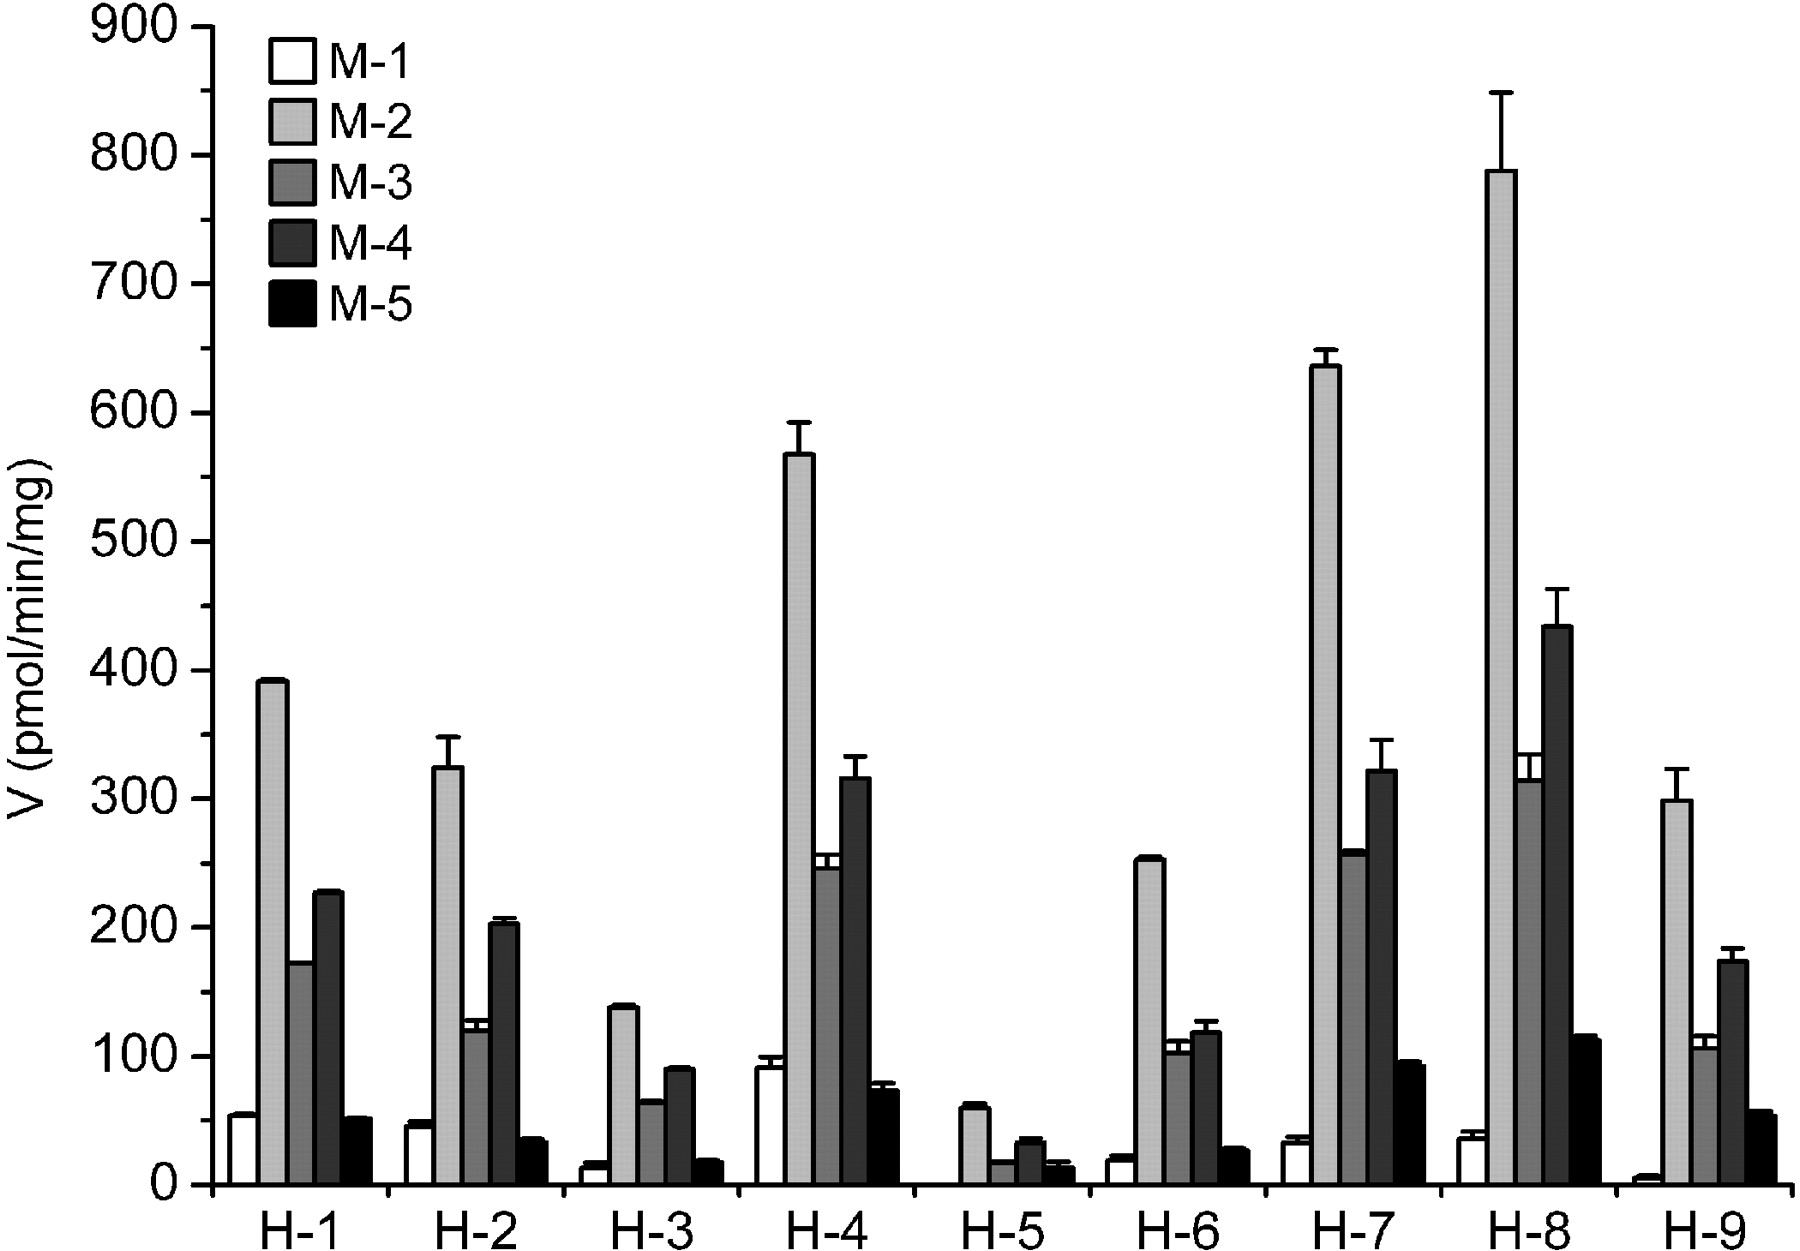
Metabolism of MPA in nine different human liver samples (H1-H9). MPA (100 μM) was incubated with liver microsomes (0.3 mg/ml) for 10 min. Mean ± S.D. of duplicate incubations.
Chemical Inhibition Study. Chemical inhibition studies were performed by adding different human P450 inhibitors to the incubation mixture of MPA (10 μM) before the addition of the NADPH-generating system. The serum level of MPA can be as high as 1.7 μM (Ghatge et al., 2005). The selection of a 10 μM concentration was based on the Km value, and a relatively high substrate concentration was selected so that adequate metabolites were generated for the convenience of detection. The selective inhibitors of eight major P450s and their concentrations were as follows (Bjornsson et al., 2003): furafylline (10 μM) for CYP1A2, 8-methoxypsoralen (2.5 μM) for CYP2A6, thioTEPA (50 μM) for CYP2B6 (Rae et al., 2002), montelukast (2 μM) for CYP2C8 (Walsky et al., 2005), sulfaphenazole (10 μM) for CYP2C9, omeprazole (20 μM) for CYP2C19 (Ko et al., 1997), quinidine (10 μM) for CYP2D6, clomethiazole (50 μM) for CYP2E1, and ketoconazole (1 μM) for CYP3A4. 8-Methoxypsoralen is known as a mechanism-based inhibitor, so it was preincubated with HLMs, buffer, and the NADPH-generating system at 37°C for 3 min (Koenigs et al., 1997), and the reaction was initiated by the addition of MPA. Furafylline was a potent competitive inhibitor for CYP1A2 (Sesardic et al., 1990); therefore, it was used without preincubation.
Troleandomycin (Anzenbacher et al., 1998), ketoconazole (Li et al., 2006), sulfaphenazole (Kobayashi et al., 2003), and furafylline (Kobayashi et al., 2003) were found to be inhibitors of rat or minipig CYP3A, CYP2C, and CYP1A, respectively. Therefore, inhibitory effects of troleandomycin (25 μM), ketoconazole (1 μM), sulfaphenazole (10 μM), and furafylline (10 μM) toward MPA (10 μM) metabolism in RLMs and PLMs were examined. Troleandomycin was preincubated with liver microsomes, buffer, and the NADPH-generating system at 37°C for 10 min, and the reaction was initiated by the addition of MPA.
Kinetic Study. To estimate kinetic parameters, MPA (5-100 μM) was incubated with liver microsomes (0.3 mg/ml) for 10 min. When the substrate concentration was lower than 5 μM, so few metabolites were produced by the liver microsomes that it was difficult to accurately measure the velocities. For recombinant CYP3A4, MPA (2-40 μM) was incubated with CYP3A4 (10 nM) for 10 min for kinetic analysis. The apparent Vm and Km values were calculated from nonlinear regression analysis of experimental data according to the Michaelis-Menten equation. Preliminary experiments were carried out to make sure that formation of metabolites was in the linear range of both reaction time and the concentration of microsomes.
Results
Detection of MPA Metabolites in Different Species. After MPA (100 μM) was incubated with HLMs (0.5 mg/ml) and the NADPH-generating system for 30 min, at least five main new peaks (M-1-M-5) were detected by LC-UV (Fig. 2). These new peaks were not observed in the negative controls without NADPH or without substrate or without microsomes (data not shown). The formation rate of the main metabolites was in the following order: M-2 > M-4 > M-3 > M-5 ≈ M-1 in HLMs (Table 1). To investigate interindividual differences, MPA (100 μM) was incubated with HLMs (0.3 mg/ml) from nine donors for 10 min, and the results showed more than a 10-fold difference in the biotransformation rates (Fig. 3). Despite rates of metabolism fluctuating in different samples, relative abundance of main metabolites was constant (M-2 > M-4 > M-3 > M-5 ≈ M-1).
Formation rates of different MPA metabolites (M-1-M-5) in different species
MPA (100 μM) was incubated with liver microsomes (0.3 mg/ml) for 10 min. The rates of formation are expressed in picomoles per milligram per minute. Results represent the average of duplicate incubations.
To compare species differences, PLMs and RLMs were also included to study MPA metabolism. Similar metabolites profiles were obtained from PLMs and RLMs, where M-2, M-3, and M-4 were the dominant metabolites (Table 1).
Identification of Metabolites. The positive-ion mode was adopted for structure analysis because it is more sensitive than the negative-ion mode in present investigation. Mass spectra were dominated by [M+K]+. The m/z for the [M+K]+ of M-1, M-2, M-3, M-4, M-5, and MPAs were 457.1, 441.1, 441.1, 441.1, 423.1, and 425.1, respectively. In accordance, the mol. wt. was calculated to be 418, 402, 402, 402, and 384 for M-1 to M-5 (Table 1), indicating the incorporation of one (M-2, M-3, and M-4)- or two (M-1)-oxygen atoms or loss of hydrogen (M-5) (Table 1).
The structures of the three major monohydroxylated metabolites of MPA, namely M-2, M-3, and M-4, were determined by 1H NMR (Table 2). M-2 was the most abundant metabolite, and the most distinctive spectra changes were involved in the C6 region. The 6α-methyl proton signal at 1.07 ppm (3H, d) was replaced by 1.43 ppm (3H, s), indicative of hydroxylation at 6β position, and the 4-proton signal at 5.79 ppm (1H, s) was replaced by 6.04 ppm (1H, s) (Table 2). Moreover, the 1H NMR spectrum of M-2 was in agreement with those reported for 6β-hydroxy-MPA (Fang et al., 1986; Guo et al., 2006); therefore, M-2 was identified as 6β-hydroxy-MPA.
1H NMR data for MPA and its metabolites (M-2, M-3, and M-4)

Inhibition of MPA metabolism by selective P450 inhibitors in HLMs. The selective inhibitors of eight major P450s and their concentrations were as follows: furafylline (10 μM) for CYP1A2, 8-methoxypsoralen (2.5 μM) for CYP2A6, thioTEPA (50 μM) for CYP2B6, montelukast (2 μM) for CYP2C8, sulfaphenazole (10 μM) for CYP2C9, omeprazole (20 μM) for CYP2C19, quinidine (10 μM) for CYP2D6, clomethiazole (50 μM) for CYP2E1, and ketoconazole (1 μM) for CYP3A4. Mean ± S.D. of duplicate incubations.
1H NMR spectrum of M-3 was characterized by the simultaneous shift about 0.2 ppm toward the low field for 2α-H, 2β-H, and 6β-H compared with MPA (Table 2). The methyl groups at 6, 18, 19, 21, and 23 were intact, and the 19-methyl signal at 1.18 ppm (3H, s) shifted slightly to 1.26 ppm (3H, s). In comparison with the spectra changes between 1β-hydroxytestosterone and testosterone in 1H NMR (Krauser et al., 2004), M-3 was tentatively identified as 1β-hydroxy-MPA. The signal appeared at 4.11 ppm (1H, m) and was assigned to the 1α proton. Final confirmation of the structure requires comparison with the authentic standard.
M-4 was tentatively identified as 2β-hydroxy-MPA based on the following observation (Table 2): the five methyl groups were intact, the 2α-proton at 2.35 ppm (1H, m) was replaced by 4.23 ppm (1H, q), and the 1α-proton at 1.7 ppm (1H, m) was replaced by 2.68 ppm (1H, m). Again, final proof of the structure awaits comparison with synthetic standard.
M-1 and M-5 were not separated in large quantity because of low transformation rate. Their structures were inferred indirectly by subsequent metabolism of M-2, M-3, and M-4. After 10-min incubation with HLMs (0.5 mg/ml) and the NADPH-generating system at 37°C, both purified M-2 and M-4 (about 10 μM) were able to produce M-1, which suggested that M-1 was hydroxylated consecutively at the 2β and 6β positions, i.e., 2β-, 6β-dihydorxy MPA (mol. wt. = 418). M-3 (mol. wt. = 402) was unstable at 37°C, pH 7.4; it slowly converted to M-5 (mol. wt. = 384), suggesting loss of water. In accordance, the structure of M-5 is proposed to be 1,2-dehydro MPA.
Chemical Inhibition Studies. P450 phenotyping and kinetic studies were conducted only for three dominant monohydroxylated metabolites, i.e., M-2, M-3, and M-4. Selective inhibitors of the nine major P450s were used to screen the P450 isoforms responsible for formation of the metabolites in HLMs (Fig. 4). Among tested inhibitors, ketoconazole inhibited MPA metabolism almost completely, with no metabolites detectable. 8-Methoxypsoralen also inhibited formation of three metabolites by about 50%. Inhibitors of other P450 isoforms did not show significant inhibition (less than 20% inhibition). Therefore, CYP3A4 might be the major P450 isoform involved in the formation of M-2, M-3, and M-4.
Inhibition of MPA metabolism in RLMs and PLMs by CYP3A, CYP1A, and CYP2C inhibitors was also performed. In PLMs, troleandomycin (25 μM) and ketoconazole (1 μM) inhibited the formation of three metabolites (M-2-M-4) by about 50 and 60%, respectively. In RLMs, troleandomycin and ketoconazole inhibited the formation of three metabolites by about 30 and 60%, respectively. Compared with the other two metabolites, M-2 was less sensitive to the inhibitory effect of troleandomycin and ketoconazole. Furafylline and sulfaphenazole exhibited less than 10% inhibition in both RLMs and PLMs for the formation of three metabolites.
Assay with Recombinant Human P450s. To further verify P450 isoforms involved in the metabolism of MPA, activity of MPA hydroxylation was determined using nine cDNA-expressed P450 isoforms. The there main metabolites (M-2, M-3, and M-4) were formed exclusively by CYP3A4. None of the three metabolites were detected in the incubation with CYP1A2, CYP2A6, CYP2B6, CYP2C8, CYP2C9, CYP2C19, CYP2D6, or CYP2E1 (less than 0.01 pmol/min/pmol P450). Therefore, all three metabolites were ascribed to CYP3A4.
Correlation Study. Correlation was the highest between the formation of three metabolites (M-2, M-3, and M-4) and testosterone 6β-hydroxylation (CYP3A4, r > 0.9) (Table 3), paclitaxel 3′-p-hydroxylation (CYP3A4, r > 0.9). MPA hydroxylation also correlated with phenacetin O-deethylation (CYP1A2, r = 0.6), coumarin 7-hydroxylation (CYP2A6, r = 0.8), and paclitaxel 6α-hydroxylation (CYP2C8, r = 0.8). These correlations probably result from a high correlation among individual P450 isoforms (r = 0.7 between CYP1A2 and CYP3A4, r = 0.9 between CYP2A6 and CYP3A4, and r = 0.9 between CYP2C8 and CYP3A4). Moreover, recombinant CYP1A2, CYP2A6, and CYP2C8 failed to metabolize MPA. Therefore, CYP3A4 was the major P450 isoform involved in the formation of M-2, M-3, and M-4 in HLMs.
Correlation (r) values between formation rates of MPA metabolites (M-2, M-3, and M-4) and P450 isoform-specific activities
MPA (10 μM) was incubated with liver microsomes (0.3 mg/ml) for 10 min.
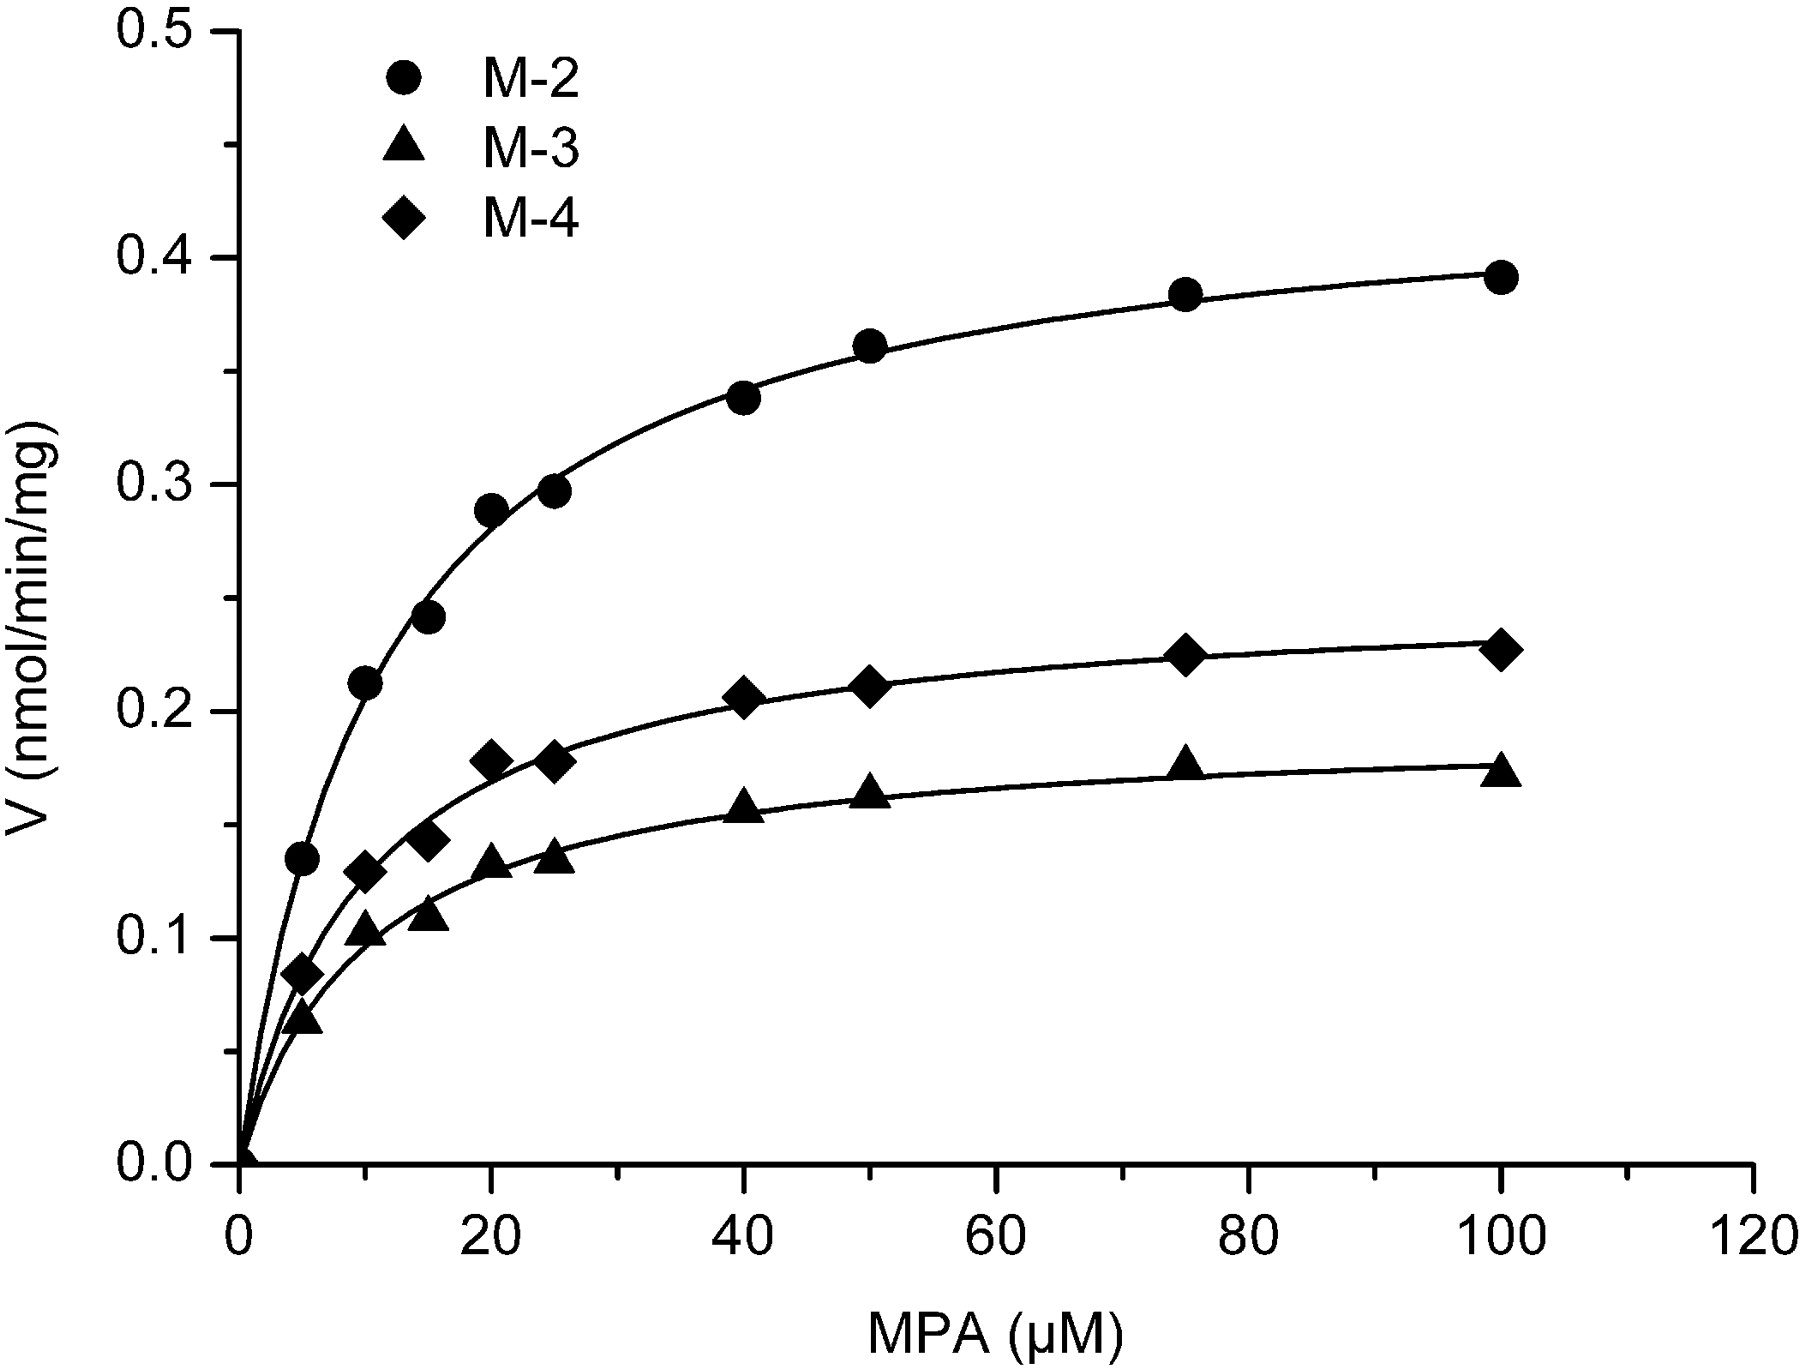
Kinetics of MPA Metabolism. The H1 liver sample was selected for kinetic study because it represented moderate CYP3A4 activity. In liver microsomes, formation rates of MPA metabolites were linear up to 0.3 mg/ml microsomal protein and 10 min of incubation. Thus, 0.3 mg/ml HLMs and 10 min were adopted in the following kinetic assay. Because of limitation of detection sensitivity and low biotransformation rate, it is difficult to accurately quantify the metabolites in low substrate concentration range; therefore, the range of substrate concentrations for kinetic analysis in liver microsomal assay was 5 to 100 and 2 to 40 μM in CYP3A4. In the concentration range tested, MPA hydroxylation obeyed the Michaelis-Menten kinetics, as evidenced by Eadie-Hofstee plot (data not shown). The kinetic parameters, including Km and Vm for MPA hydroxylation, are listed in Table 4, and results of typical kinetic experiments of MPA hydroxylation in HLMs are graphically displayed in Fig. 5. All three metabolites exhibited similar Km values in HLMs (around 10 μM) and recombinant CYP3A4 (range from 6.1 to 11.4 μM), indicating comparable binding affinities toward these hydroxylation sites (Table 4). In PLMs and RLMs, however, the Km values were higher and more diversified (Table 4), reflecting species differences. The intrinsic clearance (Vm/Km) was highest for M-2 among the three metabolites in the incubation system with HLMs, PLMs, and recombinant CYP3A4, suggesting M-2 was the major metabolism pathway. The Vm/Km value for M-4 was the highest in PLMs.
Kinetic parameters of MPA metabolism in HLMs, RLMs, PLMs, and recombinant CYP3A4
Km values are in micromolar, and Vm values are in picomoles per milligram per minute for liver microsomes or in minutes−1 for CYP3A4. The range of substrate concentrations was 5 to 100 μM for liver microsomes or 2 to 40 μM for CYP3A4.

Michaelis-Menten plots of MPA metabolism in H1 liver microsomes. MPA (5.0-100 μM) was incubated with HLMs (0.3 mg/ml) at 37°C for 10 min with the NADPH-generating system.
Discussion
The 6α-methyl and 17-acetoxy in MPA makes it more resistant to hepatic metabolism than progesterone (McCamish et al., 1980). These structure modifications improve the pharmacokinetics behavior of MPA by increasing the half-life and oral bioavailability. Nevertheless, the slow metabolism property also made metabolic studies more difficult (McCamish et al., 1980). In an in vitro MPA metabolism study dated back to 1980, McCamish et al. (1980) isolated three metabolites of MPA in the incubation system of RLMs. C6 and C2 were proposed as hydroxylation sites for two metabolites by mass spectra (McCamish et al., 1980). In vivo evidence suggested that hydroxylation is the main reaction involved in MPA metabolism (Helmreich and Huseby, 1962). The preferred hydroxylation sites were 2-, 6-, and 21-positions (Sturm et al., 1991), with 6β,21-dihydroxy-MPA as the main metabolite (Helmreich and Huseby, 1962; Fukushima et al., 1979). Although it has been extensively studied in vivo, MPA metabolism by modern methodology was relatively poorly documented (Dollery, 1998, M17-21; Lobo, 1999; Mimura et al., 2003). For example, the structures of the metabolites were mostly proposed by mass spectra and were not fully characterized. For in vivo studies, some artifacts would be introduced during long hydrolysis and extraction process of urine or stool (Castegnaro and Sala, 1962; Fukushima et al., 1979).
After incubation with HLMs, the main MPA metabolites were proposed to be 6β-, 2β-, and 1β-hydroxy MPA by LC/MS and 1H NMR (Tables 1 and 2). Hydroxylation at 6β- and 2β-positions was in agreement with previous speculations (McCamish et al., 1980; Sturm et al., 1991). We also observed a dehydro MPA (M-5), which was observed by McCamish et al. (1980). Previous studies suggested that the MPA 21-hydroxylation represented one of the major metabolism routes (Helmreich and Huseby, 1962; Sturm et al., 1991); however, the structure of 21-hydroxy MPA or 6β,21-dihydroxy-MPA was not confirmed by 1H NMR. The 21-hydroxy MPA was not detected, or at least not a major metabolite in the present study. M-2, M-3, and M-4, three major metabolites, were excluded from being 21-hydroxy MPA because the 1H NMR spectra showed that the 21-protons were intact. M-1 (mol. wt. = 418) was proposed to be 2β-,6β-dihydroxy MPA because it was a metabolite of both M-2 (6β-hydroxy MPA) and M-4 (2β-hydroxy MPA). M-5 was a degradation product of M-3 (1β-hydroxy MPA), and mass spectra suggested loss of water (mol. wt. 384 versus 402). Therefore, the structure of M-5 was proposed to be 1,2-dehydro MPA. M-2, M-3, and M-4 are dominant metabolites, which account for more than 85% of the five metabolites. Although M-1 and M-5 are the minor metabolites in vitro, they could be the major metabolites in vivo, where lower substrate concentration and longer biotransformation time were expected.

Proposed metabolic pathway of MPA in HLMs.
Under linear conditions, i.e., 0.3 mg/ml HLMs and 10-min incubation, formation of M-1 and M-5 was negligible; therefore, kinetic and P450 phenotyping studies were conducted only for the dominant monohydroxylated metabolites, i.e., M-2, M-3, and M-4. CYP3A4 was identified as the main P450 isoform involved in MPA metabolism in HLMs by the following observation: 1) ketoconazole inhibited the formation of M-2, M-3, and M-4 almost completely; 2) only CYP3A4 was able to catalyze MPA to M-2, M-3, and M-4; and 3) the formation of M-2, M-3, and M-4 correlated with testosterone 6β-hydroxylation. This result was in agreement with the study by monitoring the parent drug disappearance (Kobayashi et al., 2000). In HLMs, 8-methoxypsoralen inhibited the metabolite formation by about 50%. However, 8-methoxypsoralen also inhibited the formation of MPA metabolites to a similar extent when MPA was incubated with recombinant CYP3A4 (data not shown). Therefore, the inhibitory effect of 8-methoxypsoralen toward MPA metabolism in HLMs resulted from its inhibitory effect toward CYP3A4. The contribution of CYP2A6 to the formation of three metabolites of MPA was negligible because none of the metabolites was detected when MPA was incubated with recombinant CYP2A6. In accordance, the metabolic pathway of MPA was proposed in Fig. 6.
The spectra of metabolites were in general rather similar among liver microsomes from human, rat, and minipig. In PLM or RLM incubation systems, M-2 was also the most abundant metabolite, followed by M-4 and then by M-3 (Table 1). Ketoconazole, a CYP3A inhibitor, inhibited the metabolite formation in both PLM and RLM incubation systems, which indicated the possible involvement of CYP3A in MPA metabolism. The involvement of CYP3A in MPA metabolism has also been confirmed in rats based on parent drug disappearance (Mimura et al., 2003). These results suggested that rat and minipig could be surrogate models for man in MPA metabolism study.
Although MPA itself rather than its metabolites was regarded as the active form (Ghatge et al., 2005), the biological activities of its metabolites were not fully characterized. The structure of M-5 is of interest because it resembles quinoids that might eventually produce reactive oxygen species that are genotoxic (Siddique et al., 2006). However, M-5 was not separated in adequate amounts for toxicological analysis because of low yield, and such a hypothesis is worth further investigation.
In conclusion, three main hydroxylation sites of MPAs were proposed to be the 6β, 2β, and 1β positions, which lead to five major metabolites. The main metabolites were generated by CYP3A in human. PLMs and RLMs metabolized MPA in a similar way to HLMs. Clarification of MPA metabolites and the involving P450 isoforms is helpful to the studies of pharmacological and toxicological properties of metabolites.
Acknowledgments
We thank Dr. Hong-Bin Xiao (Dalian Institute of Chemical Physics, Chinese Academy of Sciences) for LC/MS analysis and Dr. Hong Wei (The Third Military Medical University of China) for the generous gift of minipig livers.
Footnotes
-
This study was supported by the 973 Program (Grant 2007CB707802) of the Ministry of Science and Technology of China, by the National Natural Science Foundation of China (Grant 30772608), by the Dalian Institute of Chemical Physics Innovation Fund, and by the Dalian Institute of Chemical Physics Ph.D. Exploration Fund (Grant S200617) of the Chinese Academy of Sciences.
-
doi:10.1124/dmd.108.022525.
-
ABBREVIATIONS: MPA, medroxyprogesterone acetate; HRT, hormone replacement therapy; P450, cytochrome P450; HLM, human liver microsome; PLM, minipig liver microsome; RLM, rat liver microsome; thioTEPA, triethylenethiophosphoramide; HPLC, high-performance liquid chromatography; MS, mass spectrometry; LC, liquid chromatography; NMR, nuclear magnetic resonance.
- Received June 14, 2008.
- Accepted August 20, 2008.
- The American Society for Pharmacology and Experimental Therapeutics


