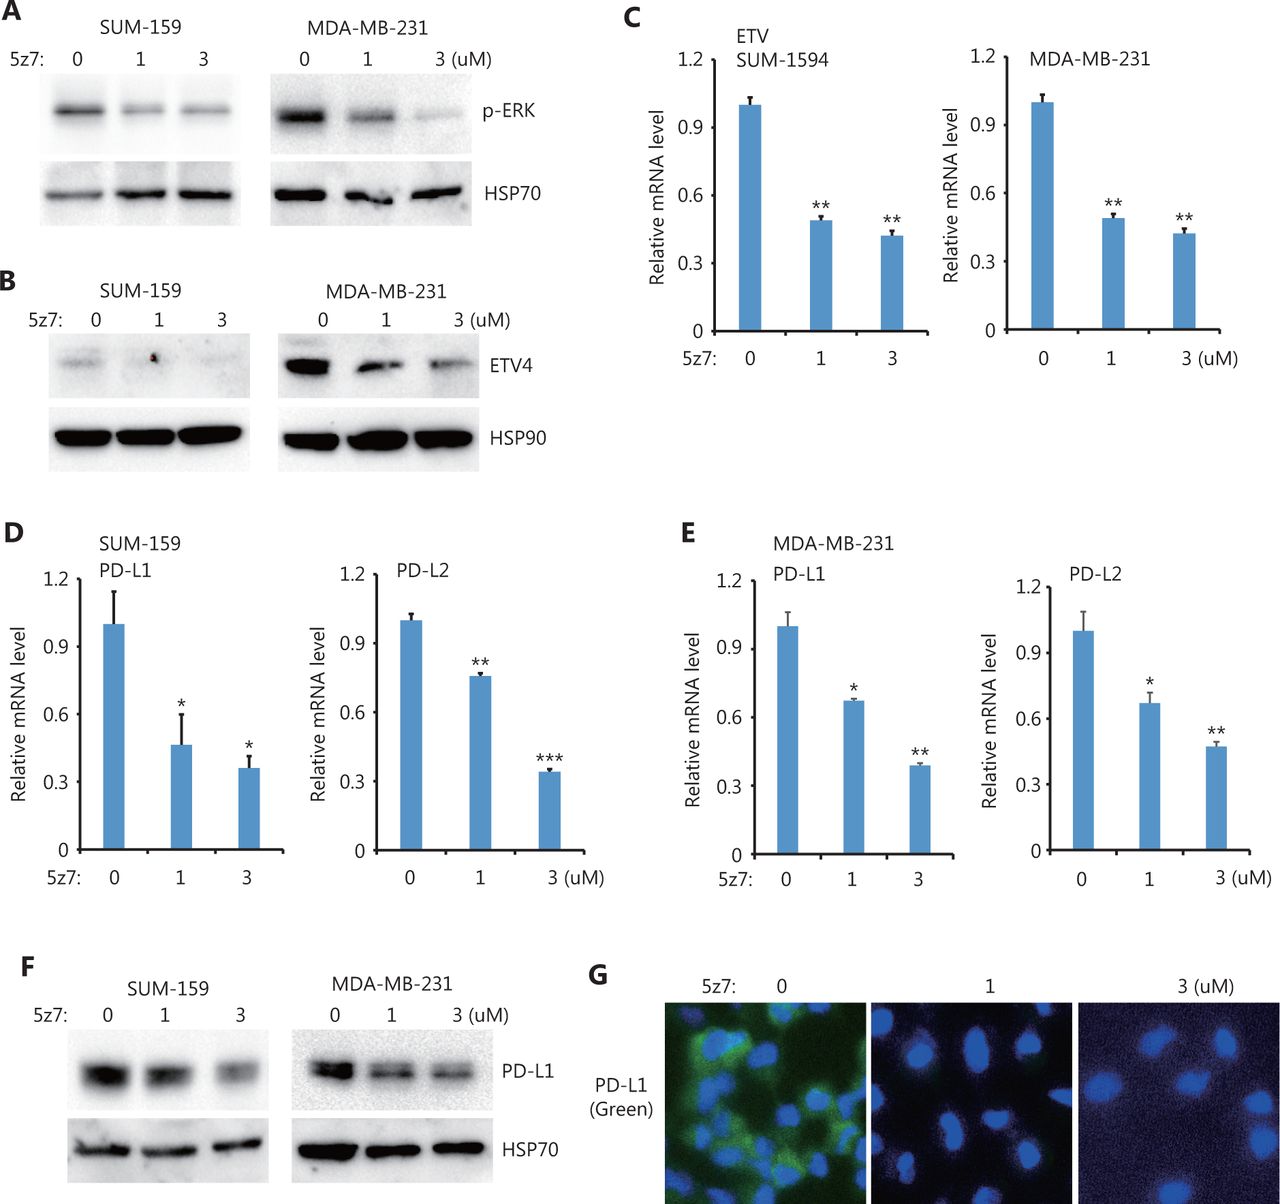
TAK1 inhibition downregulated ETV4, ERK phosphorylation, PD-L1, and PD-L2. (A) SUM-159 and MDA-MB-231 cells were treated with the TAK1 inhibitor, 5z7, for 48 h, and ERK phosphorylation was measured by Western blot. HSP70 was used as the loading control. (B) SUM-159 and MDA-MB-231 cells were treated with 5z7 for 48 h. ETV4 protein levels were measured by Western blot. HSP90 was used as the loading control. (C) SUM-159 and MDA-MB-231 cells were treated with 5z7 at different doses for 48 h. The qRT-PCR was used to measure ETV4 expression in each group. (D) SUM-159 cells were treated with 5z7 for 48 h. The qRT-PCR was used to determine PD-L1 and PD-L2 mRNA levels in each group. (E) MDA-MB-231 cells were treated with 5z7 for 48 h. The qRT-PCR was used to determine PD-L1 and PD-L2 expressions in each group. (F) SUM-159 and MDA-MB-231 cells were treated with 5z7 for 48 h. PD-L1 protein levels were measured by Western blot. HSP70 was used as the loading control. (G) Representative immunofluorescence images of PD-L1 expression (green) with and without 5z7 treatment. *P < 0.05; **P < 0.01; ***P < 0.001.