

Abstract
OBJECTIVE At present there are no serological indicators with high sensitivity and specificity to diagnose colorectal cancer (CRC). This study was designed to establish a serum protein fingerprinting technique coupled with a pattern-matching algorithm to distinguish patients of colorectal cancer from that of benign colorectal diseases (BCD) and healthy people (HP).
METHODS Proteomic patterns were procured by surface enhanced laser desorption/ionization-time of flight-mass spectrometry (SELDI-TOF-MS). Sera randomly selected from 73 CRC patients, 31 HP and 16 BCD patients were analyzed to develop a classification tree, which is a standard configuration to distinguish the sera of CRC patients and noncancer cohorts. The classifiction tree proved to be valid by using 120 double-blind sera samples in the test group, including 73 CRC, 31 HP and 16 BCD.
RESULTS At the protein masses of 4,467 Da; 8,131 Da; 8,939 Da; 9,192 Da; 9,134 Da; 8,221 Da; 5,928 Da; 8,324 Da; and 11,732 Da, protein levels from the CRC, HP and BCD patients in the preliminary group were significantly different based on software analysis. Correct ratio, sensitivity and specificity of the method were up to 98.33%, 97.26% (71/73) and 100% (47/47), respectively. Results of double-blind detection for the test group indicated that the correct ratio, sensitivity and specificity of the method were 96.77% (116/20), 95.89% (70/73) and 97.87% (46/47), respectively.
CONCLUSION Via comparative proteomics analysis of the serum from CRC, HP and BCD patients using the SELDI-TOF-MS method, CRC can be diagnosed rapidly and correctly with high sensitivity and specificity.
keywords
- surface enhanced laser desorption/ionization-time of flight-mass spectrometry
- colorectal cancer
- serum
- biomarkers
- proteomics
Colorectal Cancer (CRC) is the fourth commonest form of cancer occurring worldwide, with about 400,000 new cases in men and 380,000 in women annually.[1] It is estimated that each year 390,000 deaths from colorectal cancer still occur worldwide annually, with the survival rate less than 40%.[2] Many patients already have developed advanced CRC at the time of diagnosis. Thus, overall early detection or determination with high specificity of CRC is needed. In this study, we used a surfaced enhanced laser desorption/inoization mass spectrometry approach to distinguish CRC from noncancer cohorts, and further to identify specific biomarkers for early detection of CRC.
Materials and Methods
Materials
Sera examined
Blood samples from patients diagnosed with either CRC or benign colorectal diseases (BCD) were procured from the 150th Center Hospital of the PLA during 199~2002. A healthy people (HP) cohort was obtained from screening clinics open to the general public during the same period. Sera from 73 CRC patients, 31 HP and 16 BCD patients were randomly selected into the preliminary and test group (Table 1). Eight specimens were randomly allocated into a test group. Cases involved in the present study have similar exposure history and of the same race, with ages ranging from 45~60 years (median age, 56 years). The gender ratio (male/female) was 2:1 for the CRC group, 1.91:1 for BCD and 1.76 for HP. Patients in the CRC group were all confirmed as primary CRC by pathological examination. Conditions that effect serum protein content, such as hepatopathy, were excluded from this study.
Reagents and Equipment
Urea, methyl cyanide, trifluoroacetic acid, sinapinic acid (SPA), CHAPS, and Tris-HCl were all obtained from Sigma Inc. Proteinchip Biology System (PBS II) and the corresponding IMAC3-Cu chips, surface enhanced laser desorption/ionization-time of flight-mass spectrometry (SELDI-TOF-MS) were purchased from Ciphergen Biosystems Inc.
Methods
Sample Collection
Collected blood samples were stored at 4 °C immediately and centrifuged 3 h later at 1,000 rpm for 30 min at 4°C. The serum was distributed into lOOμl aliquots and stored frozen at -80 °C.
Sample preparation
The frozen serum was thawed and centrifuged at 20,000 g, 4 °C for 10 min. Serum (20 μl) from each specimen was vortexed with 40 μl of U9 buffer solution (consisting of 9 mmol/L urea, 2% CHAPS, 50 mmol/L Tris-HCl, pH 9.0) in a 1.5 ml microfuge tube at 4 °C for 20 min to denature the protein. The denatured samμle (20 μl) and 240 μl of U1 buffer (1:9 dilution of U9) were mixed and shaken for 30 min at 4°C.
Chip preparation
IMAC3-Cu chips were coated with 50 μl of 100 mM CuSO4 on each array and shaken at a speed of 200 rpm for 5 min. The chips were rinsed 5 times with distilled water, and 50 μl of a 100 mM sodium acetate (pH 4.0) solution was added to each array and shaken for 5 min at 200 rpm. One hundred and fifty pl of absorption/desorption buffer (including 100 mM sodium phosphate, 500 mM NaCl, pH 7.0) was applied to each well and the chips shaken on a platform shaker for 5 min at room temperature. The absorption/ desorption buffer was discarded and the buffer washing step repeated once. Fifty μl of the diluted serum/buffer mixture was added to each well followed by shaking of the chips at 4 °C for 60 min. The serum/buffer mixture was discarded, and the buffer washing step was repeated three times. Then the chips were washed rapidly in 1 mM HEPES (pH 7.0), removed from the shaker and air-dried. Seventy-five pl of methyl cyanide, and 75μl of 1%TFA were added to the energy absorbing molecule (EAM) (SPA) shaken for 5 min and centrifuged for 1 min. Before SELDI analysis, 1 μl of SPA was applied onto each chip array twice, letting the array surface air dry between each SPA application.
Chip analysis
Mass spectrometer accuracy was calibrated using the NP20 chip, which includes an all-in-one peptide molecular mass standard. Equipment parameters were set and the procedures for reading the data were programmed in the Ciphergen Proteinchip. The computer receives the primary data at a speed of 1 × 10⁹ Hz and plots the protein mass spectrograph rapidly and accurately. The Y-axis represents the protein relative mass, and the X-axis the protein mass/charge (M/Z).
Protein mass/charge (M/Z)
Proteins binding to the EAM ionized with the bombarding by the SELDI-TOF-MS helium/neon laser. In the electric field, proteins with different M/Z utilize different times passing in a vacuum tube with a certain length. Protein M/Z was proportional to the square of ion flying time. From the formulas E = UZ = 1/2 mv2, t = L/v, we know M/Z = Kt2 = (2 U/L2) t2, in which Z represents ionic charge, U represents voltage, V represents flying speed, L represents voltage of the electric field, and K represents constant.
Protein mass
Once the protein ion beam with positive charge interacts with the detector, an electroamplifier converts the instant electric current (It = Q/t, Q stands for the charges detected at the t point) into the protein mass.
Data analysis
Protein mass and protein M/Z detected by the chips were analyzed by Ciphergen ProteinChip software and BioMarker Wizard software.
Statistical analysis
Analysis of variance (ANOVA) was performed to compare protein mass with the same M/Z among the groups. Data grouping and correlation were analyzed using the BioMarker Pattern (the objects were classified by the decision tree method).
Carcinoembryonic antigen (CEA) determination for the CRC group
ELISA was used to determine serum CEA for 146 CRC patients, with CEA < 5 μl/L.
Results
Data analysis for the preliminary group
Mass spectrograph analysis
Comparisons among the CRC, BCD and HP group were performed by BioMarker Wizard software. Results indicated that there were 36 protein peaks with differences (Fig.1), in which 35 differences of protein mass were found between CTC and the noncancer group (P<0.05).

Analyzing results of biomarker wizard software. Y axis represents the protein mass, X axis represents protein mass/charge. Diamond represents CRC patients, square represents HP, and crass represents BCD patients.
Biomarker analysis
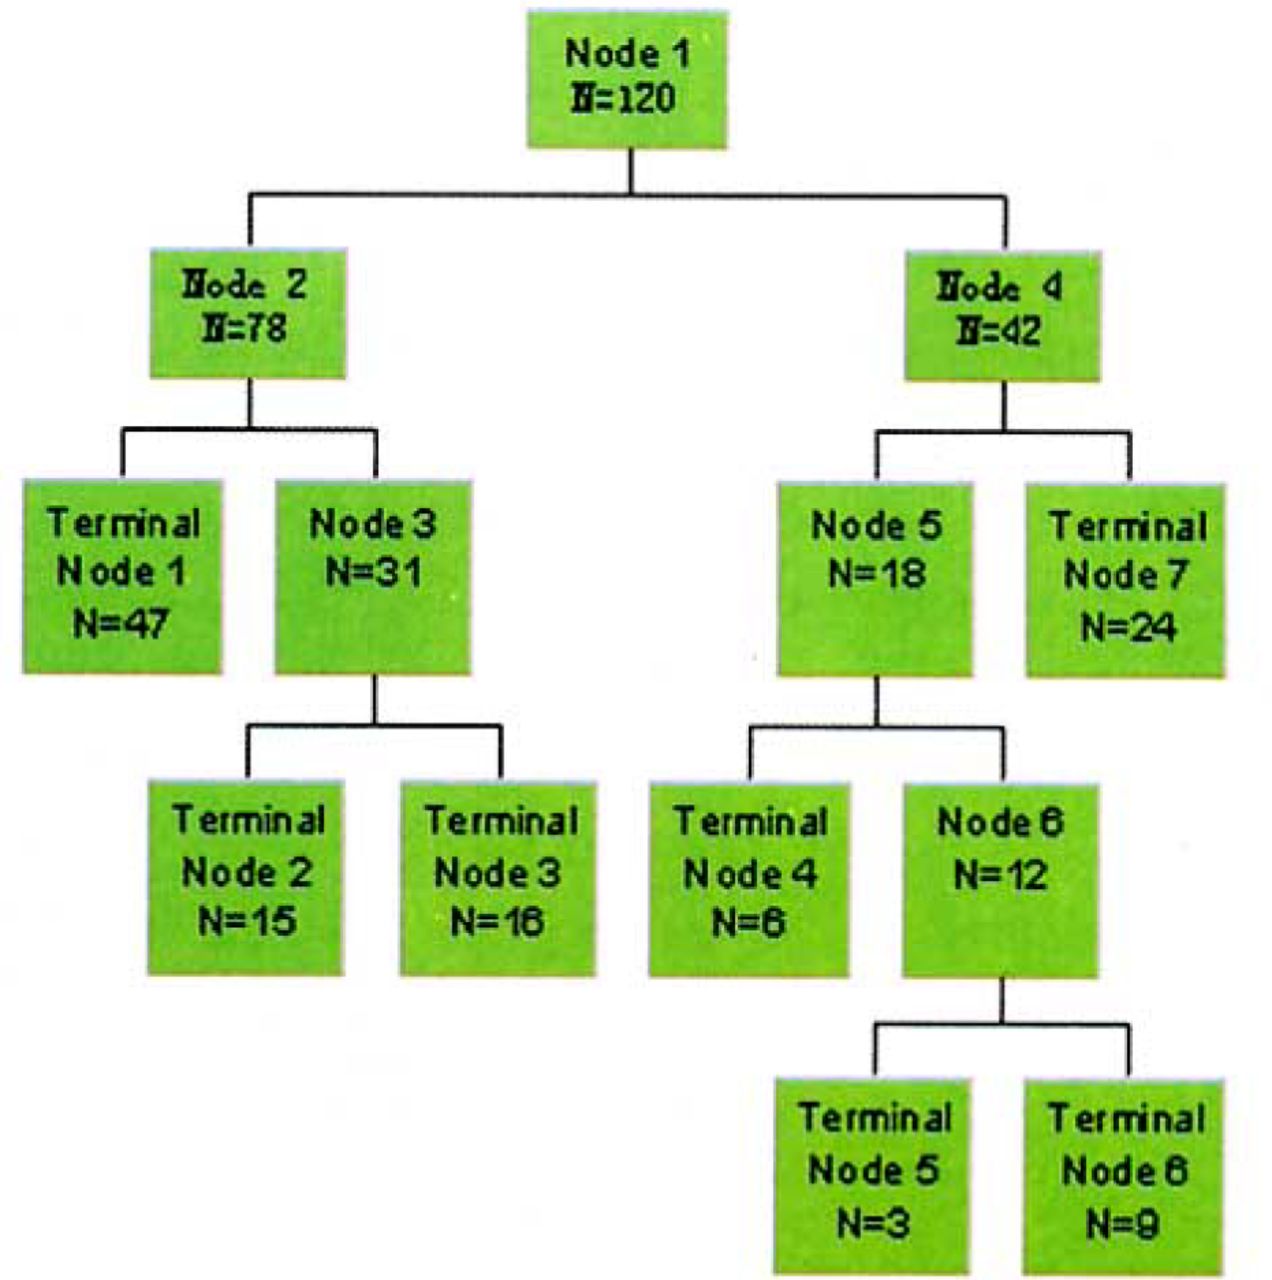
Using Biomarker Wizard and Biomarker Pattern software, we analyzed components of serum protein for the 73 CRC, 31 HP and 16 BCD patients in the preliminary group, and found that 9 protein masses of 4,467; 8,131; 8,939; 9,192; 9,134; 8,221; 5,928; 8,324; and 11,732 Da can accurately separate HP from CRC and BCD. This generates seven terminal nodes (Fig.2), in which node 1, 2 and 6 only include 142 CRC patients. Samples which satisfied the formula- 0.147 (M5928) - 0.467 (M8939) + 0.527 (M8131) - 0.695 (M8221) ≤-1.050 (M stands for protein mass) were assigned to node 1. Samples which satisfied the formula 0.044 (M5369) - 0.060 (M5982) + 0.467 (M8131) + 0.024 (M8939) - 0.860 (M8324) - 0.193 (M9192) ≤ 0.211 were assigned to node 2. Samples satisfying the formula M8221 ≥ 2.213 were assigned to node 6. Samples satisfying the formula 0.044 (M5369) - 0.060 (M6632) + 0.467 (M8131) + 0.024 (M8939) - 0.860 (M8324) - 0.193 (M9192) ≥ 0.211 were assigned to node 3, which consisted of 32 BCD patients. Samples which satisfied the formula 0.288 (M4467) - 0.958 (M8324) ≥ 0.373 were assigned to node 7, which consisted of 48 HP. Node 4 and 5 were classified as HP, consisting of 12 and six cases respectively. Two CRC patients placed in node 4, and two in node 5 were misclassified as HP. Samples satisfying M11 732 ≤ 0.721 and M8 221 ≤ 2.213 were placed in node 4 and 5 respectively. The chances for the samples to be misclassified were 1.67%.

Sketch map of grouping. Node 1 is parent node, N represents sample size in a node.
Serum protein content of CRC, BCD and HP at 8 939Da in the preliminary group
Serum protein content of HP was significantly higher than that of BCD and CRC, and CRC was higher than that of BCD. Differences of serum protein content among HP, BCD and CRC were significant (P < 0.01) (Fig.3, Table 2).

Serum protein content of CRC, BCD and HP at 8 939 Da in preliminary group.Serum protein content of HP was significantly higher than that of BCD and CRC, and CRC higher than BCD.
Validity
Results analyzed by the BioMarker Pattern software demonstrated that using the nine protein mass as biomarkers, 71 CRC, 31 HP and 16 BCD patients in the preliminary group were correctly classified, with the correct ratio up to 98.33% (118/120).
Sensitivity and specificity
In the preliminary group, 71 CRC were correctly classified as CRC, 47 HP and BCD patients as noncancer patients. The sensitivity and specificity were 97.26% (71/73) and 100% (47/47) respectively.
Double-blind detection for the test group
Correct ratio of prediction
Using the nine protein mass as biomarkers to perform double-blind detection for the test group, we found that 70 CRC, 30 HP and 16 BCD patients were correctly classified, with an accuracy of 96.67% (116/120).
Sensitivity and specificity
In the test group, 70 CRC were correctly classified as CRC, 30 HP and 16 BCD patients as noncancer patients. The sensitivity and specificity were 97.26% (71/73) and 100% (47/47) respectively.
Comparison of the SELDI-TOF-MS method with pathological examination results
For the 146 CRC cases confirmed by pathological examination, four cases were misclassified by SELDI-TOF-MS, including two staged as Dukes’ B, and two as Dukes’ C.
EUSA detection results
Using serum CEA as controls, 88 out of 146 CRC patients were correctly diagnosed, with a sensitivity of 60.27% ; 22 out of 94 noncancer patients were correctly diagnosed, with the specificity as low as 23.2%.
Reproducibility
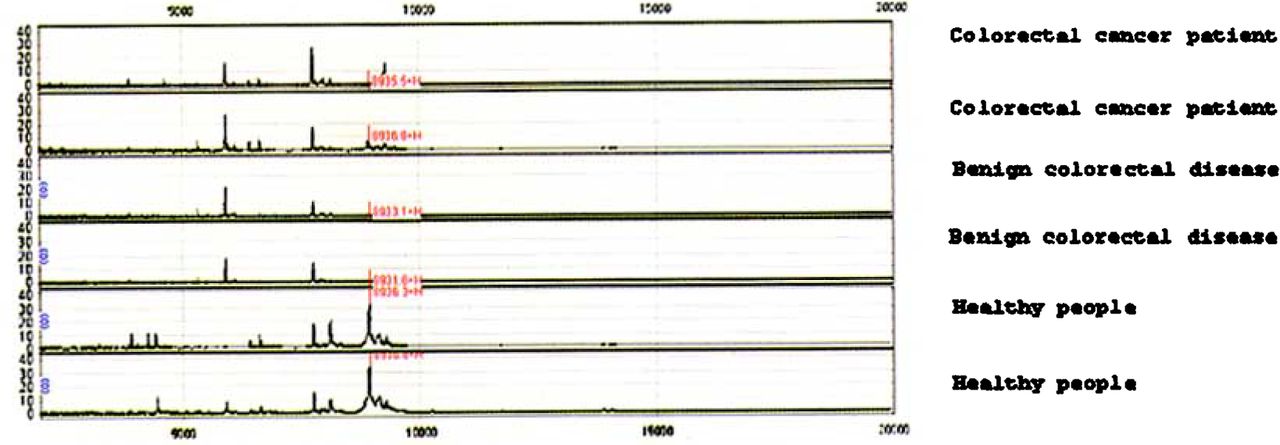
The reproducibility of SELDI chips of different batches was determined based on the same method and equipment parameters for samples randomly selected. Detection results for the same kind of chips with different batches were considered to be same (Fig.4), indicating that the SELDI-TOF-MS method was hardly affected by other untreated factors.

Reproducibility of protein chip. X axis stands for protein mass of each chip one spot, and Y axis for protein mass of each chip two spots.
Discussion
According to epidemiologic data, the incidence of CRC in China is showing an increasing trend with the 5-year survival rate of only 50% due to a lack of an early detection method with high specificity. Therefore, new technologies for the detection of early-stage CRC are urgently needed. In this study, based on the SELDI-TOF-MS technique, we found a convenient diagnostic method with high sensitivity and specificity to diagnose CRC using proteomic patterns in serum.
The function of genes is not only dependent on their sequence. A great deal of information and variation expressed by genes can lead to complexity of disease mechanisms. [3,4] Protein molecules can be described by up to four levels of structure based on certain DNA sequences. Proteins reflect information expressed by the gene directly, and protein abnormities result in disease initiation. Thus, explorations for variations in protein components and characteristics are key areas of interest in studies relating genes to disease.
SELDI protein chips, with a solid point surface that can bond to proteins, were designed based on the combination of chromatography and mass spectroscopy. Proteins and peptides that cannot be detected by the conventional methods can be determined by mass spectroscopy due to its high sensitivity. With the SELDI-TOF-MS method, the protein spectrum of the patient is compared with that of normal people or patients with a certain disease, even or spectrums in the Gene Bank. By this technique we may discover specific disease-related proteins, ascertain their characteristics, [5] obtain maximum proteomic information and explore novel tumor markers.
In the past, researchers utilized various analytical chemical technologies to investigate proteins, such as chromatograms, two-dimensional gel electrophoresis, action spectrum and mass spectrum etc. Because of these techniques require, high costs, complex procedures and considerable time, these analytical chemical methods have not been employed for large-scale screening and clinical diagnosis. On the other hand, SELDI, which was developed from matrix-assisted laser desorption ionization (MALDI), has several advantages over other technologies. It can detect and analysze untreated samples, has a high degree of sensitivity (detection limit: l~50 fmole protein) over a broad detection range (0.5~500 kDa), uses low specimen volume (0.5~400 p.1), is an easy and rapid procedure (finished in about 30 min) with high specificity, has reliable reproducibility and does not destroy detected proteins.[6–8]
According to some overseas reports, the SELDI-TOF-MS method can be used to screen specific markers in serum. By this procedure, Petricoin et al. [9] identified specific biomarkers in serum to distinguish ovarian neoplastic from non-neoplastic disease, and Adam et al. [10] identified prostate-specific biomarkers. A sensitivity of 60.27% and a specificity of 23.2% was obtained when using serum CEA as a control. Sensitivity and specificity were lower than we found in our study. Serum CEA is regarded as one of the markers for a curative effect in clinical use, as it is significantly related to CRC relapse and metastasis.[11]
Compared with the pathological examination results, two patients staged as Dukes’ B and 2 as Dukes’ C were misclassified, while none in Dukes’ A stage were misclassified, showing that the biomarkers selected by SELDI-TOF-MS can not only be used in diagnosing middle stage and advanced CRC, but in CRC staged as Duke’ A. The high sensitivity and specificity obtained by the serum protein profiling approach presented in this study demonstrated that SELDI protein chip mass spectrometry can facilitate discovery of better biomarkers for CRC and provide an innovative clinical diagnostic platform that has the potential to improve the early detection and differential diagnosis of CRC. We will further purify the nine proteins identified to study their characteristics and sequences.
- Received November 30, 2004.
- Accepted March 14, 2005.
- Copyright © 2005 by Tianjin Medical University Cancer Institute & Hospital and Springer
In this issue


Jump to section
Related Articles
Cited By...
- No citing articles found.