
Main menu

  • Home
  • About
    • About CBM
    • Editorial Board
    • Announcement
  • Articles
    • Ahead of print
    • Current Issue
    • Archive
    • Collections
    • Cover Story
  • For Authors
    • Instructions for Authors
    • Resources
    • Submit a Manuscript
  • For Reviewers
    • Become a Reviewer
    • Instructions for Reviewers
    • Resources
    • Outstanding Reviewer
  • Subscription
  • Alerts
    • Email Alerts
    • RSS Feeds
    • Table of Contents
  • Contact us
  • Other Publications
    • cbm

User menu

  • My alerts

Search

  • Advanced search
Cancer Biology & Medicine
  • Other Publications
    • cbm
  • My alerts
Cancer Biology & Medicine

Advanced Search


  • Home
  • About
    • About CBM
    • Editorial Board
    • Announcement
  • Articles
    • Ahead of print
    • Current Issue
    • Archive
    • Collections
    • Cover Story
  • For Authors
    • Instructions for Authors
    • Resources
    • Submit a Manuscript
  • For Reviewers
    • Become a Reviewer
    • Instructions for Reviewers
    • Resources
    • Outstanding Reviewer
  • Subscription
  • Alerts
    • Email Alerts
    • RSS Feeds
    • Table of Contents
  • Contact us
  • Follow cbm on Twitter
  • Visit cbm on Facebook
Research ArticleOriginal Article

CD44v8-10 is a marker for malignant traits and a potential driver of bone metastasis in a subpopulation of prostate cancer cells

Rosaria A. Fontanella, Silvia Sideri, Chiara Di Stefano, Angiolina Catizone, Silvia Di Agostino, Daniela F. Angelini, Gisella Guerrera, Luca Battistini, Giulia Battafarano, Andrea Del Fattore, Antonio Francesco Campese, Fabrizio Padula, Paola De Cesaris, Antonio Filippini and Anna Riccioli
Cancer Biology & Medicine August 2021, 18 (3) 788-807; DOI: https://doi.org/10.20892/j.issn.2095-3941.2020.0495
Rosaria A. Fontanella
1Department of Anatomy, Histology, Forensic Medicine and Orthopaedics, Unit of Histology and Medical Embryology, Sapienza University, Rome 00161, Italy
  • Find this author on Google Scholar
  • Find this author on PubMed
  • Search for this author on this site
Silvia Sideri
1Department of Anatomy, Histology, Forensic Medicine and Orthopaedics, Unit of Histology and Medical Embryology, Sapienza University, Rome 00161, Italy
  • Find this author on Google Scholar
  • Find this author on PubMed
  • Search for this author on this site
Chiara Di Stefano
1Department of Anatomy, Histology, Forensic Medicine and Orthopaedics, Unit of Histology and Medical Embryology, Sapienza University, Rome 00161, Italy
  • Find this author on Google Scholar
  • Find this author on PubMed
  • Search for this author on this site
Angiolina Catizone
1Department of Anatomy, Histology, Forensic Medicine and Orthopaedics, Unit of Histology and Medical Embryology, Sapienza University, Rome 00161, Italy
  • Find this author on Google Scholar
  • Find this author on PubMed
  • Search for this author on this site
Silvia Di Agostino
2Department of Health Sciences School of Medicine – “Magna Graecia” University of Catanzaro, Catanzaro 88100, Italy
  • Find this author on Google Scholar
  • Find this author on PubMed
  • Search for this author on this site
Daniela F. Angelini
3IRCCS Fondazione Santa Lucia, Rome 00143, Italy
  • Find this author on Google Scholar
  • Find this author on PubMed
  • Search for this author on this site
Gisella Guerrera
3IRCCS Fondazione Santa Lucia, Rome 00143, Italy
  • Find this author on Google Scholar
  • Find this author on PubMed
  • Search for this author on this site
Luca Battistini
3IRCCS Fondazione Santa Lucia, Rome 00143, Italy
  • Find this author on Google Scholar
  • Find this author on PubMed
  • Search for this author on this site
Giulia Battafarano
4Bone Physiopathology Research Unit, Genetics and Rare Diseases Research Division, Bambino Gesù Children’s Hospital, IRCCS, Rome 00146, Italy
  • Find this author on Google Scholar
  • Find this author on PubMed
  • Search for this author on this site
Andrea Del Fattore
4Bone Physiopathology Research Unit, Genetics and Rare Diseases Research Division, Bambino Gesù Children’s Hospital, IRCCS, Rome 00146, Italy
  • Find this author on Google Scholar
  • Find this author on PubMed
  • Search for this author on this site
Antonio Francesco Campese
5Department of Molecular Medicine, Sapienza University, Rome 00161, Italy
  • Find this author on Google Scholar
  • Find this author on PubMed
  • Search for this author on this site
Fabrizio Padula
1Department of Anatomy, Histology, Forensic Medicine and Orthopaedics, Unit of Histology and Medical Embryology, Sapienza University, Rome 00161, Italy
  • Find this author on Google Scholar
  • Find this author on PubMed
  • Search for this author on this site
Paola De Cesaris
6Department of Life, Health and Environmental Sciences, University of L’Aquila, L’Aquila 67100, Italy
  • Find this author on Google Scholar
  • Find this author on PubMed
  • Search for this author on this site
  • ORCID record for Paola De Cesaris
  • For correspondence: paola.decesaris{at}univaq.it antonio.filippini{at}uniroma1.it
Antonio Filippini
1Department of Anatomy, Histology, Forensic Medicine and Orthopaedics, Unit of Histology and Medical Embryology, Sapienza University, Rome 00161, Italy
  • Find this author on Google Scholar
  • Find this author on PubMed
  • Search for this author on this site
  • ORCID record for Antonio Filippini
  • For correspondence: paola.decesaris{at}univaq.it antonio.filippini{at}uniroma1.it
Anna Riccioli
1Department of Anatomy, Histology, Forensic Medicine and Orthopaedics, Unit of Histology and Medical Embryology, Sapienza University, Rome 00161, Italy
  • Find this author on Google Scholar
  • Find this author on PubMed
  • Search for this author on this site
  • Article
  • Figures & Data
  • Info & Metrics
  • References
  • PDF
Loading

Article Figures & Data

Figures

  • Supplementary Materials
  • Figure 1
    • Download figure
    • Open in new tab
    • Download powerpoint
    Figure 1

    Representative images of confocal microscopy analysis of actin (red) and vinculin (green) in CD44v8-10pos and CD44v8-10neg PC3 cells. (A) In CD44v8-10neg, vinculin appears as a diffuse signal in cytoplasm of the cells and partially co-localizes with actin (merge). In CD44v8-10pos, vinculin is well evident also in the membrane protrusion (selected area). Scale bar: 40 μm. Magnification of selected area shows filopodia (arrows) in which vinculin co-localizes with actin filaments to form focal adhesions. Dashed line indicates lamellipodia frequently observed in these cells. Scale bar: 10 μm. TO-PRO3 (blue) was used for nuclear staining. (B) Representative confocal images of F-actin distribution in CD44v8-10neg cells and in CD44v8-10pos cells. In CD44v8-10pos cells are evident lamellipodia (dotted lines), filopodia*, and ruffles. Scale bars: 39 and 44 μm. Right panel shows the percentage of cells presenting lamellipodia, filopodia, and ruffles in both populations. ***P < 0.001, Student’s paired t-test.

  • Figure 2
    • Download figure
    • Open in new tab
    • Download powerpoint
    Figure 2

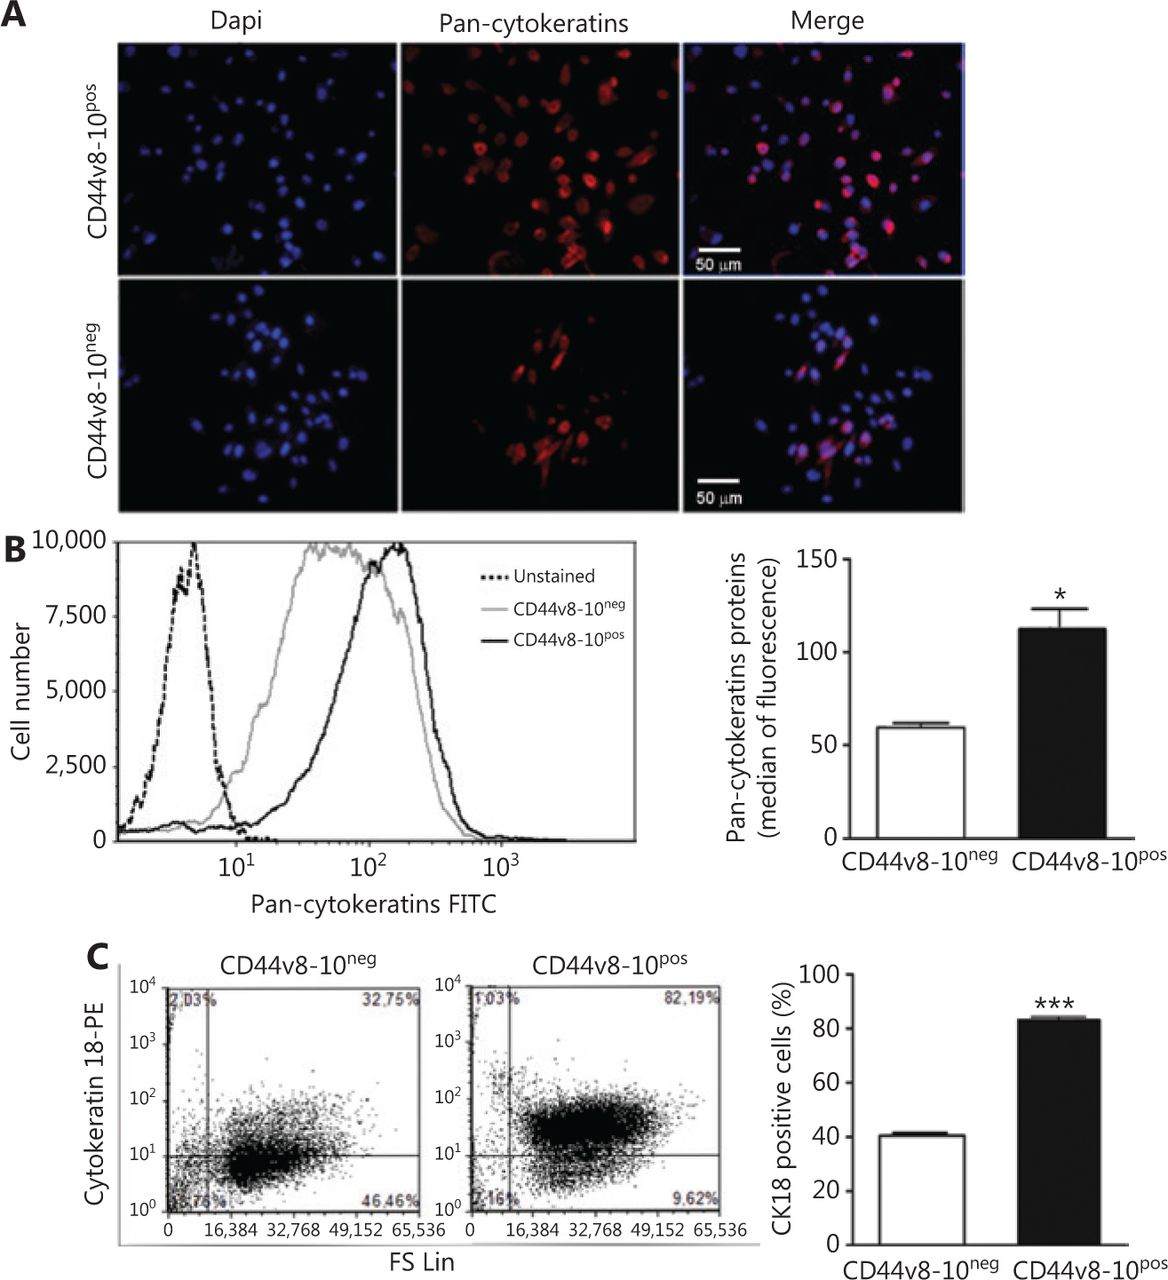
    Cytokeratin expression in PC3 subpopulations. (A) Representative immunofluorescence assay by using DAPI for nuclei staining (blue signal) and antibody for pan-cytokeratins (rhodamine, red signal). (B) Flow cytometry analysis using antibodies for pan-cytokeratins and (C) for CK18. Mean ± standard error of mean derived from the value of the median fluorescence of 3 independent experiments (B, right) and from the percentage of CK18-positive cells (C, right) of 3 independent experiments. **P < 0.01; ***P < 0.001, Student’s paired t-test. (B and C, left) Representative experiments of flow cytometry analysis for indicated cytokeratins.

  • Figure 3
    • Download figure
    • Open in new tab
    • Download powerpoint
    Figure 3

    Expression of epithelial/mesenchymal markers and reactive oxygen species (ROS) production in PC3 subpopulations. CD44v8-10pos cells show high levels of E-cadherin (A) and EpCAM (B) and low levels of vimentin (C) and N-cadherin (D) compared with CD44v8-10neg cells. (Middle panels) Histograms of E-cadherin (A), EpCAM (B), and vimentin (C) of 3 independent experiments, and the respective representative flow cytometry plots are shown in the left panels of A, B, and C. The levels of E-cadherin (A, right) and vimentin (C, right) mRNA assayed by real-time quantitative polymerase chain reaction analysis mirror the protein levels. (D, left) Whole-cell extracts of CD44v8-10pos and CD44v8-10neg PC3 cells were analyzed by Western blot for N-cadherin. β-Actin was used as control for equal amounts of proteins loaded. Each blot is representative of three experiments. (D, right) Histogram of the densitometric analysis of the Western blot of 3 separate experiments representing the fold decrease of the N-cadherin/β-actin ratio (CD44v8-10neg value set as 1). (E) Endogenous ROS levels were measured by flow cytometry using DCFDA dye fluorescence in cells treated with or without 200 μM hydrogen peroxide (H2O2) for 30 min. The graph presents 3 independent experiments and a representative flow cytometry histogram. *P < 0.05; **P < 0.01; ***P < 0.001, Student’s paired t-test.

  • Figure 4
    • Download figure
    • Open in new tab
    • Download powerpoint
    Figure 4

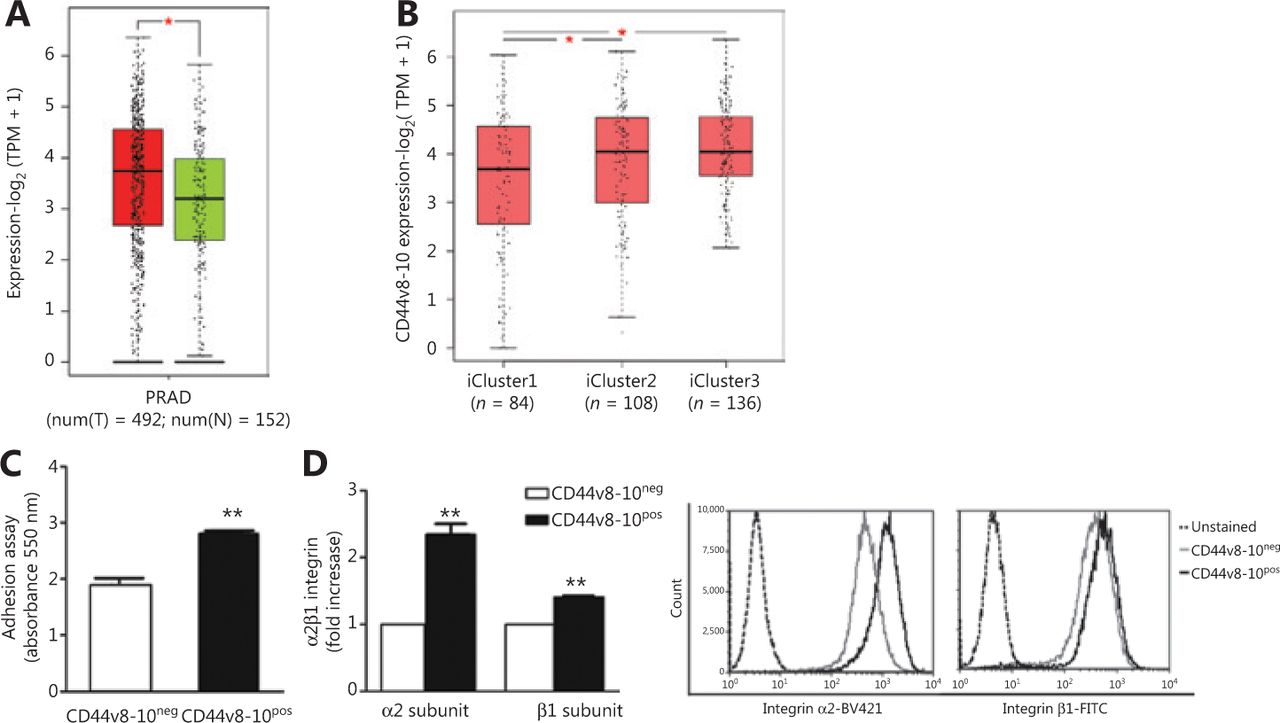
    Association between CD44v8-10 expression and the prognosis of patients with prostate cancer (PC). Adhesion ability to type I collagen of PC3 cell populations. (A) CD44v8-10 expression (ENST00000433892.6) was analyzed using GEPIA software in normal/benign samples (from TCGA and GTEx, green bar) and in prostate adenocarcinoma (PRAD from TCGA, red bar). Cancer tissue samples (n = 492) and normal tissues (n = 152). *P < 0.05, Student’s t-test. (B) Analysis of patients with PC collected by the TCGA dataset shows CD44v8-10 expression in the iClusters: iCluster1, mild prognosis; iCluster2, intermediate prognosis; iCluster3, poor prognosis. (C) The 2 PC3 subpopulations were cultivated on type I collagen-coated plates for 90 min. After staining with crystal violet, the cells were detached and the absorbance was determined using a spectrophotometer. (D) Flow cytometry analysis for α2β1-integrin, type I collagen receptor, and the relative representative flow cytometry histogram. Data represent the mean ± standard error of mean derived from 3 independent experiments. *P < 0.05; **P < 0.01; Student’s paired t-test.

  • Figure 5
    • Download figure
    • Open in new tab
    • Download powerpoint
    Figure 5

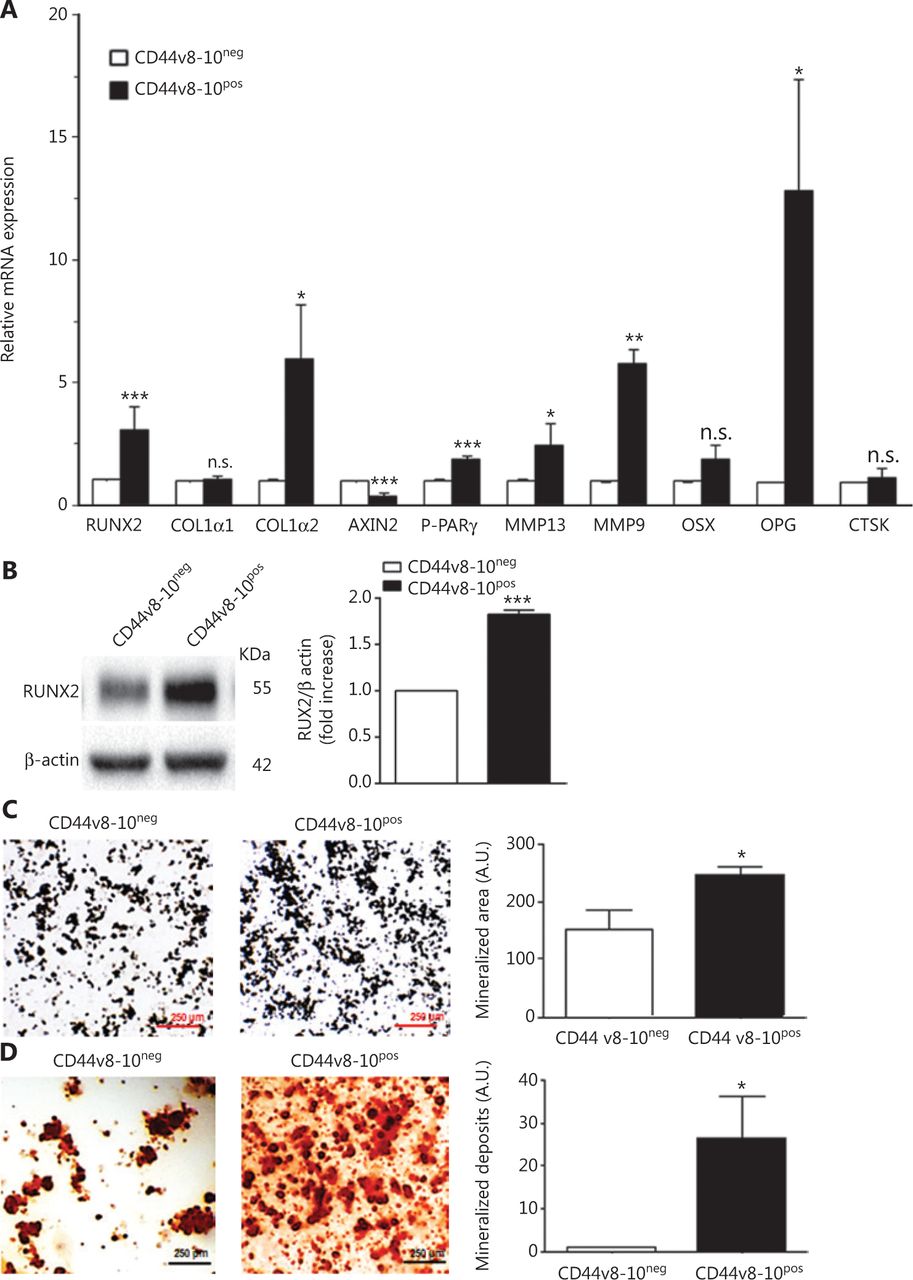
    Expression analysis of genes involved in osteomimicry process and functional assay for osteoblast-like activity. (A) Real-time quantitative polymerase chain reaction analysis for genes encoding proteins involved in osteoblast and osteoclast differentiation and function. β-actin was used as an internal control. (B, left) Whole-cell extracts of CD44v8-10pos and CD44v8-10neg PC3 cells were analyzed by Western blot for RUNX2. β-actin was used as control for equal amounts of proteins loaded. Each blot is representative of 3. (B, right) The histogram represents the densitometric analysis of Western blot of 3 separate experiments representing the fold increase of the RUNX2/β-actin ratio (CD44v8-10neg value set as 1). (C, left) CD44v8-10pos and CD44v8-10neg PC3 cell ability to release mineralized nodules revealed by von Kossa staining and (D, left) to form calcium deposits revealed by Alizarin Red staining. (C and D, right) Mean ± standard error of mean derived from 3 independent experiments performed as described in the left. *P < 0.05; **P < 0.005; ***P < 0.001 vs. CD44+, Student’s paired t-test.

  • Figure 6
    • Download figure
    • Open in new tab
    • Download powerpoint
    Figure 6

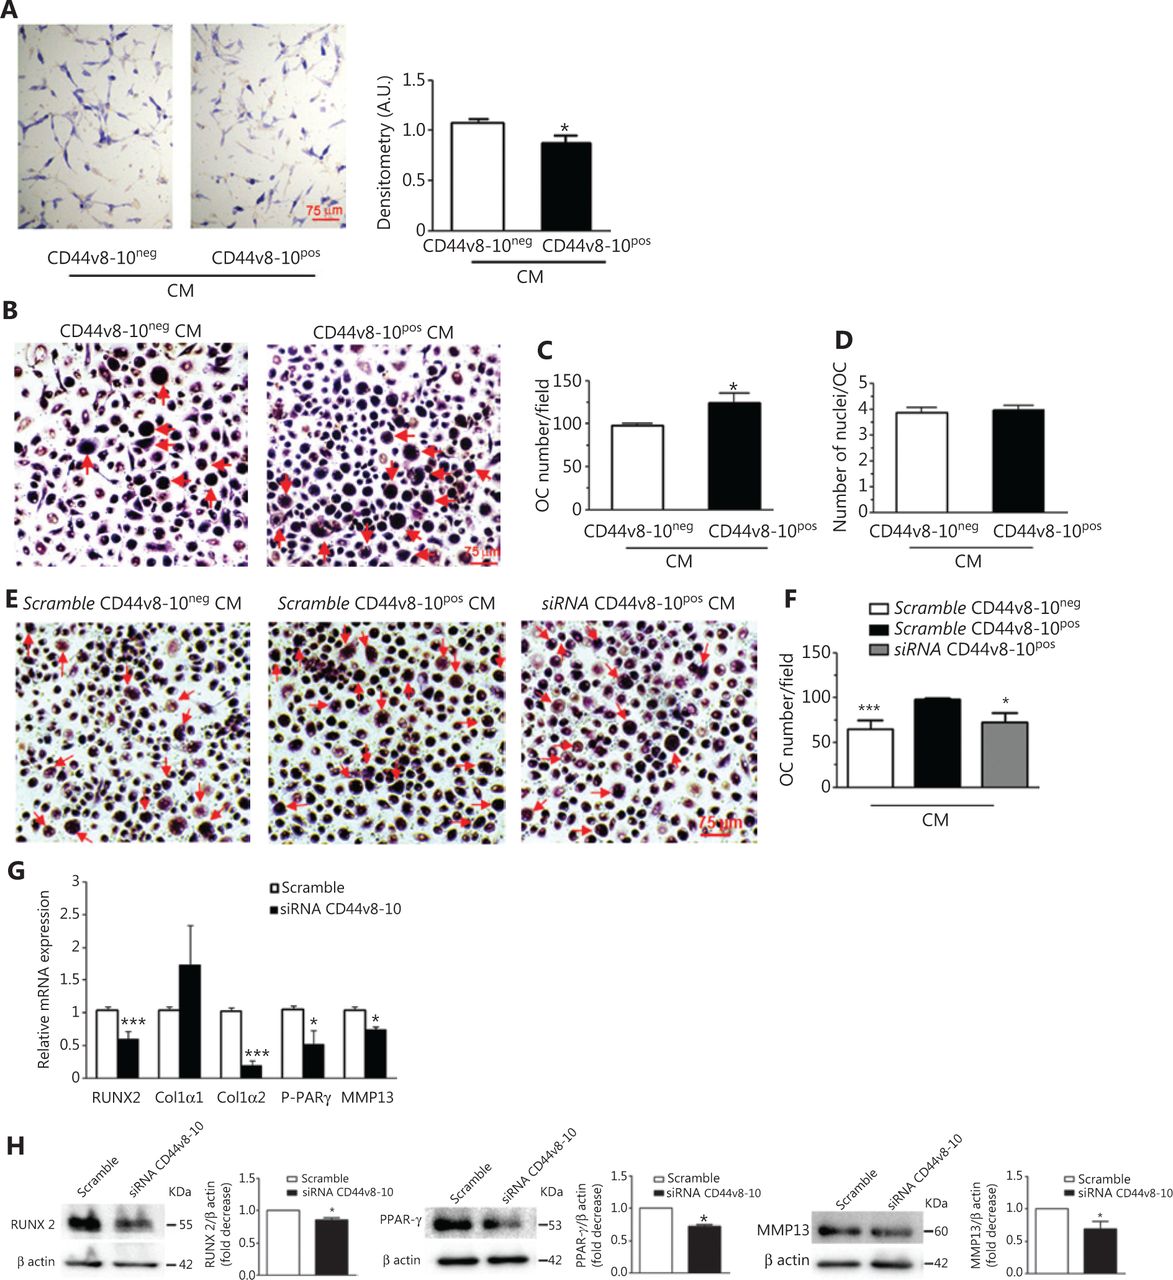
    Effects of conditioned medium (CM) from CD44v8-10pos and CD44v8-10neg PC3 cells on osteoblasts and osteoclastogenesis and effect of CD44v8-10 siRNA on osteomimicry genes expressed by CD44v8-10pos PC3 cells. Healthy-donor osteoblasts were treated 48 h with 100% CM obtained from 2 different PC3 cultures and cytochemical analysis of alkaline phosphatase (ALP) activity of osteoblasts was performed. Representative ALP staining (A, left) and densitometric analysis of ALP staining of 3 independent experiments evaluated as arbitrary units (A.U.) (A, right). Results are expressed as mean ± standard error of mean (SEM). *P < 0.05. (B) Healthy-donor peripheral blood mononuclear cells (PBMCs) were treated with 50% CM obtained from 2 different PC3 cultures and TRAcP staining was performed. In the representative images, the osteoclasts are indicated by red arrows. (C) Number of multinucleated (> 3 nuclei) TRAcP-positive osteoclasts (OC) and (D) number of nuclei per osteoclast of 3 independent experiments were evaluated. Results are expressed as mean ± SEM. *P < 0.05. (E) Three healthy-donor PBMCs were treated with 50% CM obtained from 3 different PC3 cultures treated with CD44v8-10 siRNA/scramble and TRAcP staining was performed. In the representative images the osteoclasts are indicated by red arrows. (F) Histograms show number of multinucleated (> 3 nuclei) TRAcP positive osteoclasts (OC) in the experimental setting described in panel E. Results are expressed as mean ± SEM. *P < 0.05; ***P < 0.001 vs. scramble CD44v8-10pos-derived CM treatment. Effect of CD44v8-10 siRNA on the expression of the indicated osteomimicry genes at mRNA (G) and protein (H) levels. Each Western blot is representative of three experiments. β-actin was used as control for equal amounts of proteins loaded. The histograms show the densitometric analysis of Western blot of 3 separate experiments representing the relative expression being scramble RNA value set as 1. *P < 0.05; ***P < 0.001.

  • Figure 7
    • Download figure
    • Open in new tab
    • Download powerpoint
    Figure 7

    Involvement of Wnt and TAZ pathways in CD44v8-10-mediated signaling. Whole-cell extracts of CD44v8-10pos and CD44v8-10neg PC3 cells were analyzed by Western blot for Phospho-β-catenin and total-β-catenin (A, left). β-Actin was used as control for equal amounts of proteins loaded. Each blot is representative of 3. The histograms represent the densitometric analysis of Western blot of 3 separate experiments representing the fold decrease (CD44v8-10neg PC3 cells vs. CD44v8-10pos PC3 cells) of the phospho-β-catenin/β-catenin ratio (A, right). (B) Representative immunofluorescence assay by using DAPI for nuclei staining (blue signal) and antibody for β-catenin (fluorescein, green signal). (C) TAZ and its targets expression levels were evaluated by real-time quantitative polymerase chain reaction in the 2 PC3 cell populations in basal conditions and (D) in CD44v8-10pos PC3 cells after treatment with CD44v8-10 siRNA. Results are expressed as mean ± standard error of mean. *P < 0.05; ***P < 0.001.

  • Figure 8
    • Download figure
    • Open in new tab
    • Download powerpoint
    Figure 8

    CD44v8-10pos cells produce high levels of interleukin (IL)-6 and express the immunosuppressive protein PD-L1. (A) Real-time quantitative polymerase chain reaction (RT-qPCR) analysis for IL-6 mRNA in the 2 PC3 populations (CD44v8-10neg value set as 1). (B) Enzyme-linked immunoassay for IL-6 in medium conditioned for 48 h from CD44v8-10pos and CD44v8-10neg PC3 cells. (C) RT-qPCR analysis for IL-6 mRNA in CD44v8-10pos PC3 cells after treatment with CD44v8-10 siRNA (scramble value set as 1). (D, left) Flow cytometry evaluation of the percentage of cells expressing membrane PD-L1 in the 2 PC3 cell populations. (D, right) Representative flow cytometry histogram. Data represent the mean ± standard error of mean derived from 3 independent experiments. *P < 0.05; ***P < 0.001, Student’s paired t-test.

Supplementary Materials

  • Figures
  • [cbm-18-788-s001.pdf]
PreviousNext
Back to top

In this issue

Cancer Biology and Medicine: 18 (3)
Cancer Biology & Medicine
Vol. 18, Issue 3
1 Aug 2021
  • Table of Contents
  • Index by author
Print
Download PDF
Email Article

Thank you for your interest in spreading the word on Cancer Biology & Medicine.

NOTE: We only request your email address so that the person you are recommending the page to knows that you wanted them to see it, and that it is not junk mail. We do not capture any email address.

Enter multiple addresses on separate lines or separate them with commas.
CD44v8-10 is a marker for malignant traits and a potential driver of bone metastasis in a subpopulation of prostate cancer cells
(Your Name) has sent you a message from Cancer Biology & Medicine
(Your Name) thought you would like to see the Cancer Biology & Medicine web site.
Citation Tools
CD44v8-10 is a marker for malignant traits and a potential driver of bone metastasis in a subpopulation of prostate cancer cells
Rosaria A. Fontanella, Silvia Sideri, Chiara Di Stefano, Angiolina Catizone, Silvia Di Agostino, Daniela F. Angelini, Gisella Guerrera, Luca Battistini, Giulia Battafarano, Andrea Del Fattore, Antonio Francesco Campese, Fabrizio Padula, Paola De Cesaris, Antonio Filippini, Anna Riccioli
Cancer Biology & Medicine Aug 2021, 18 (3) 788-807; DOI: 10.20892/j.issn.2095-3941.2020.0495

Citation Manager Formats

  • BibTeX
  • Bookends
  • EasyBib
  • EndNote (tagged)
  • EndNote 8 (xml)
  • Medlars
  • Mendeley
  • Papers
  • RefWorks Tagged
  • Ref Manager
  • RIS
  • Zotero
Share
CD44v8-10 is a marker for malignant traits and a potential driver of bone metastasis in a subpopulation of prostate cancer cells
Rosaria A. Fontanella, Silvia Sideri, Chiara Di Stefano, Angiolina Catizone, Silvia Di Agostino, Daniela F. Angelini, Gisella Guerrera, Luca Battistini, Giulia Battafarano, Andrea Del Fattore, Antonio Francesco Campese, Fabrizio Padula, Paola De Cesaris, Antonio Filippini, Anna Riccioli
Cancer Biology & Medicine Aug 2021, 18 (3) 788-807; DOI: 10.20892/j.issn.2095-3941.2020.0495
Twitter logo Facebook logo Mendeley logo
  • Tweet Widget
  • Facebook Like
  • Google Plus One

Jump to section

  • Article
    • Abstract
    • Introduction
    • Materials and methods
    • Results
    • Discussion
    • Conclusions
    • Supporting Information
    • Grant support
    • Acknowledgments
    • Footnotes
    • References
  • Figures & Data
  • Info & Metrics
  • References
  • PDF

Related Articles

  • No related articles found.
  • Google Scholar

Cited By...

  • No citing articles found.
  • Google Scholar

More in this TOC Section

  • Nintedanib enhances tumor cell radiosensitivity by promoting ferroptosis and modulating the ATF4/SLC7A11/GSH axis
  • A novel biguanide-derivative promotes NEDD4-mediated FGFR1 ubiquitination through BMI1 to overcome osimertinib resistance in NSCLC
  • Integrated pretreatment stratification system for pancreatic cancer: combining anatomical resectability and tumor biological parameters
Show more Original Article

Similar Articles

Keywords

  • metastasis
  • epithelial phenotype
  • EMT
  • MET
  • IL-6
  • TAZ

Navigate

  • Home
  • Current Issue

More Information

  • About CBM
  • About CACA
  • About TMUCIH
  • Editorial Board
  • Subscription

For Authors

  • Instructions for authors
  • Journal Policies
  • Submit a Manuscript

Journal Services

  • Email Alerts
  • Facebook
  • RSS Feeds
  • Twitter


© 2025 Cancer Biology & Medicine

Powered by HighWire